Wellbore real-time UI for Schlumberger
Developed a web-based platform for Schlumberger to support real-time visualization and interpretation of streaming data from well sites, enhancing operational decision-making and efficiency.
Background
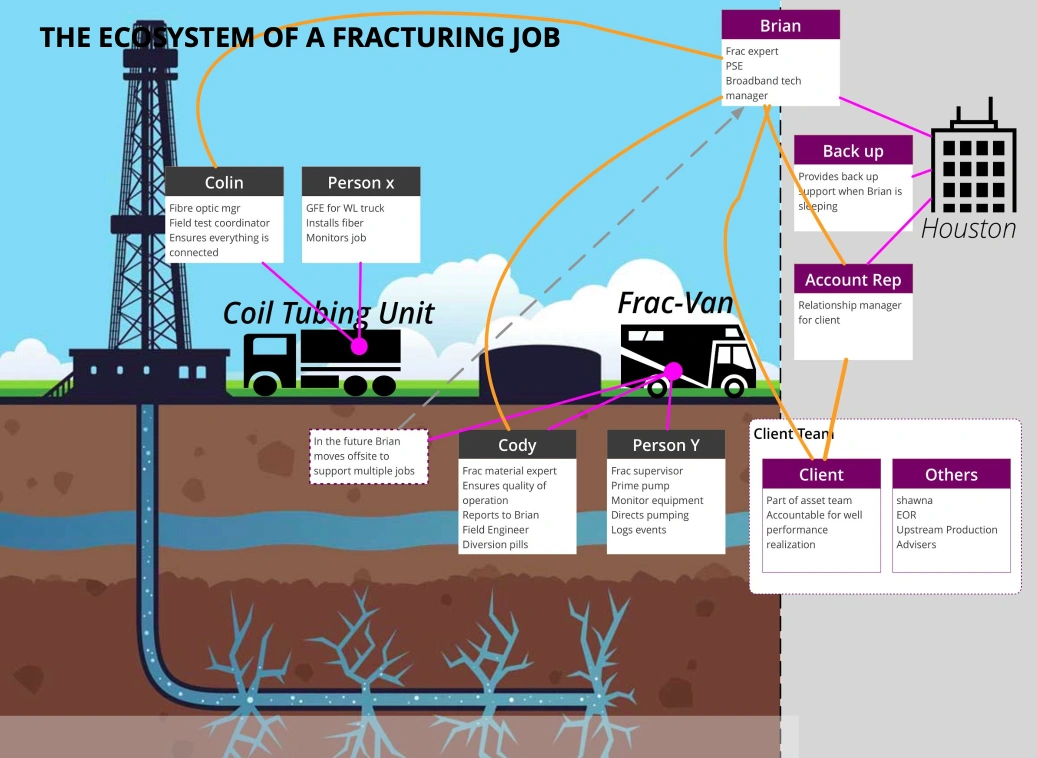
Schlumberger, a global leader in oilfield services, wanted to improve operational transparency and decision-making in its hydraulic fracturing work by giving field engineers real-time access to integrated wellbore data. The work was driven by the need for precise job execution, lower latency in decision-making, and better environmental sustainability, running each job with less waste.
My role
As a UX and design engineer, I contributed to a real-time fracturing pilot by designing and developing prototypes that visualized complex, real-time data. My responsibilities included:
- Hypothesis-driven development: Designed solutions iteratively based on real-time user feedback and validated assumptions through regular stakeholder check-ins.
- Prototyping and UX design: Created intuitive, interactive prototypes that displayed integrated fiber and pump measurements, allowing users to interpret data efficiently.
- Field observations: Observed field operations on site, gaining valuable insights to inform user-centric design decisions.
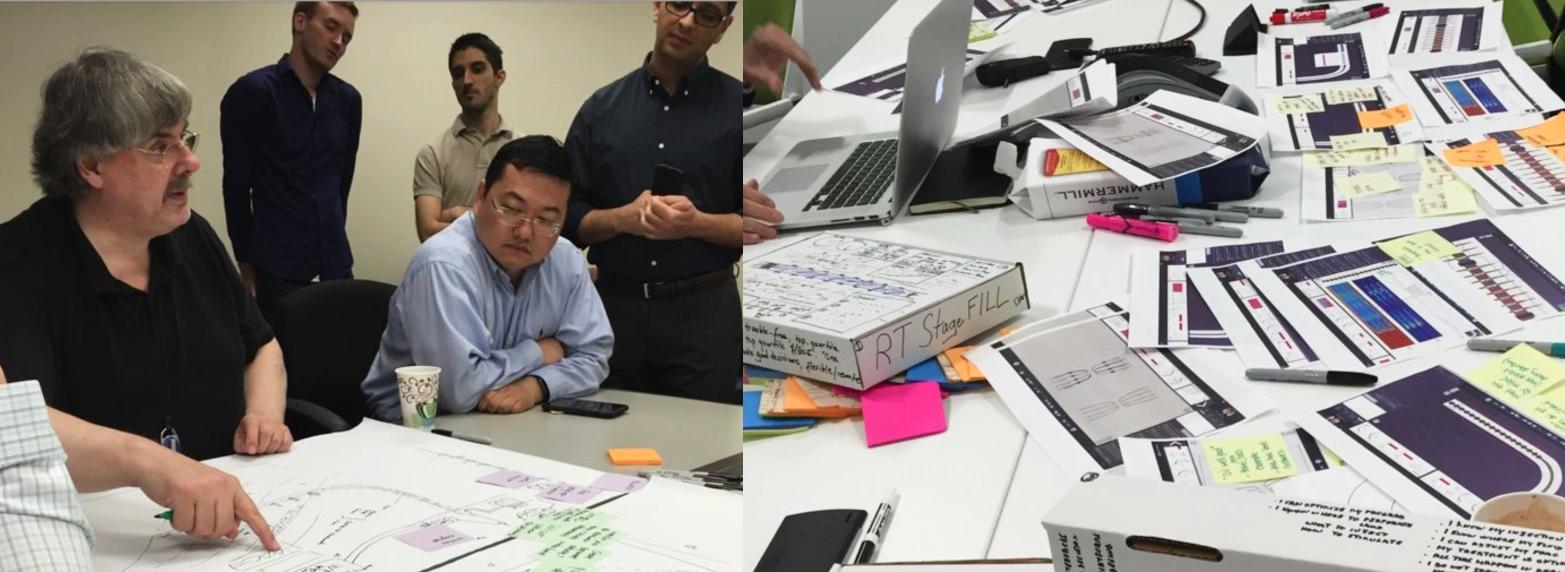
- Cross-functional collaboration: Worked closely with the client's teams across multiple US locations to ensure the design aligned with technical and operational requirements.
Features and solutions
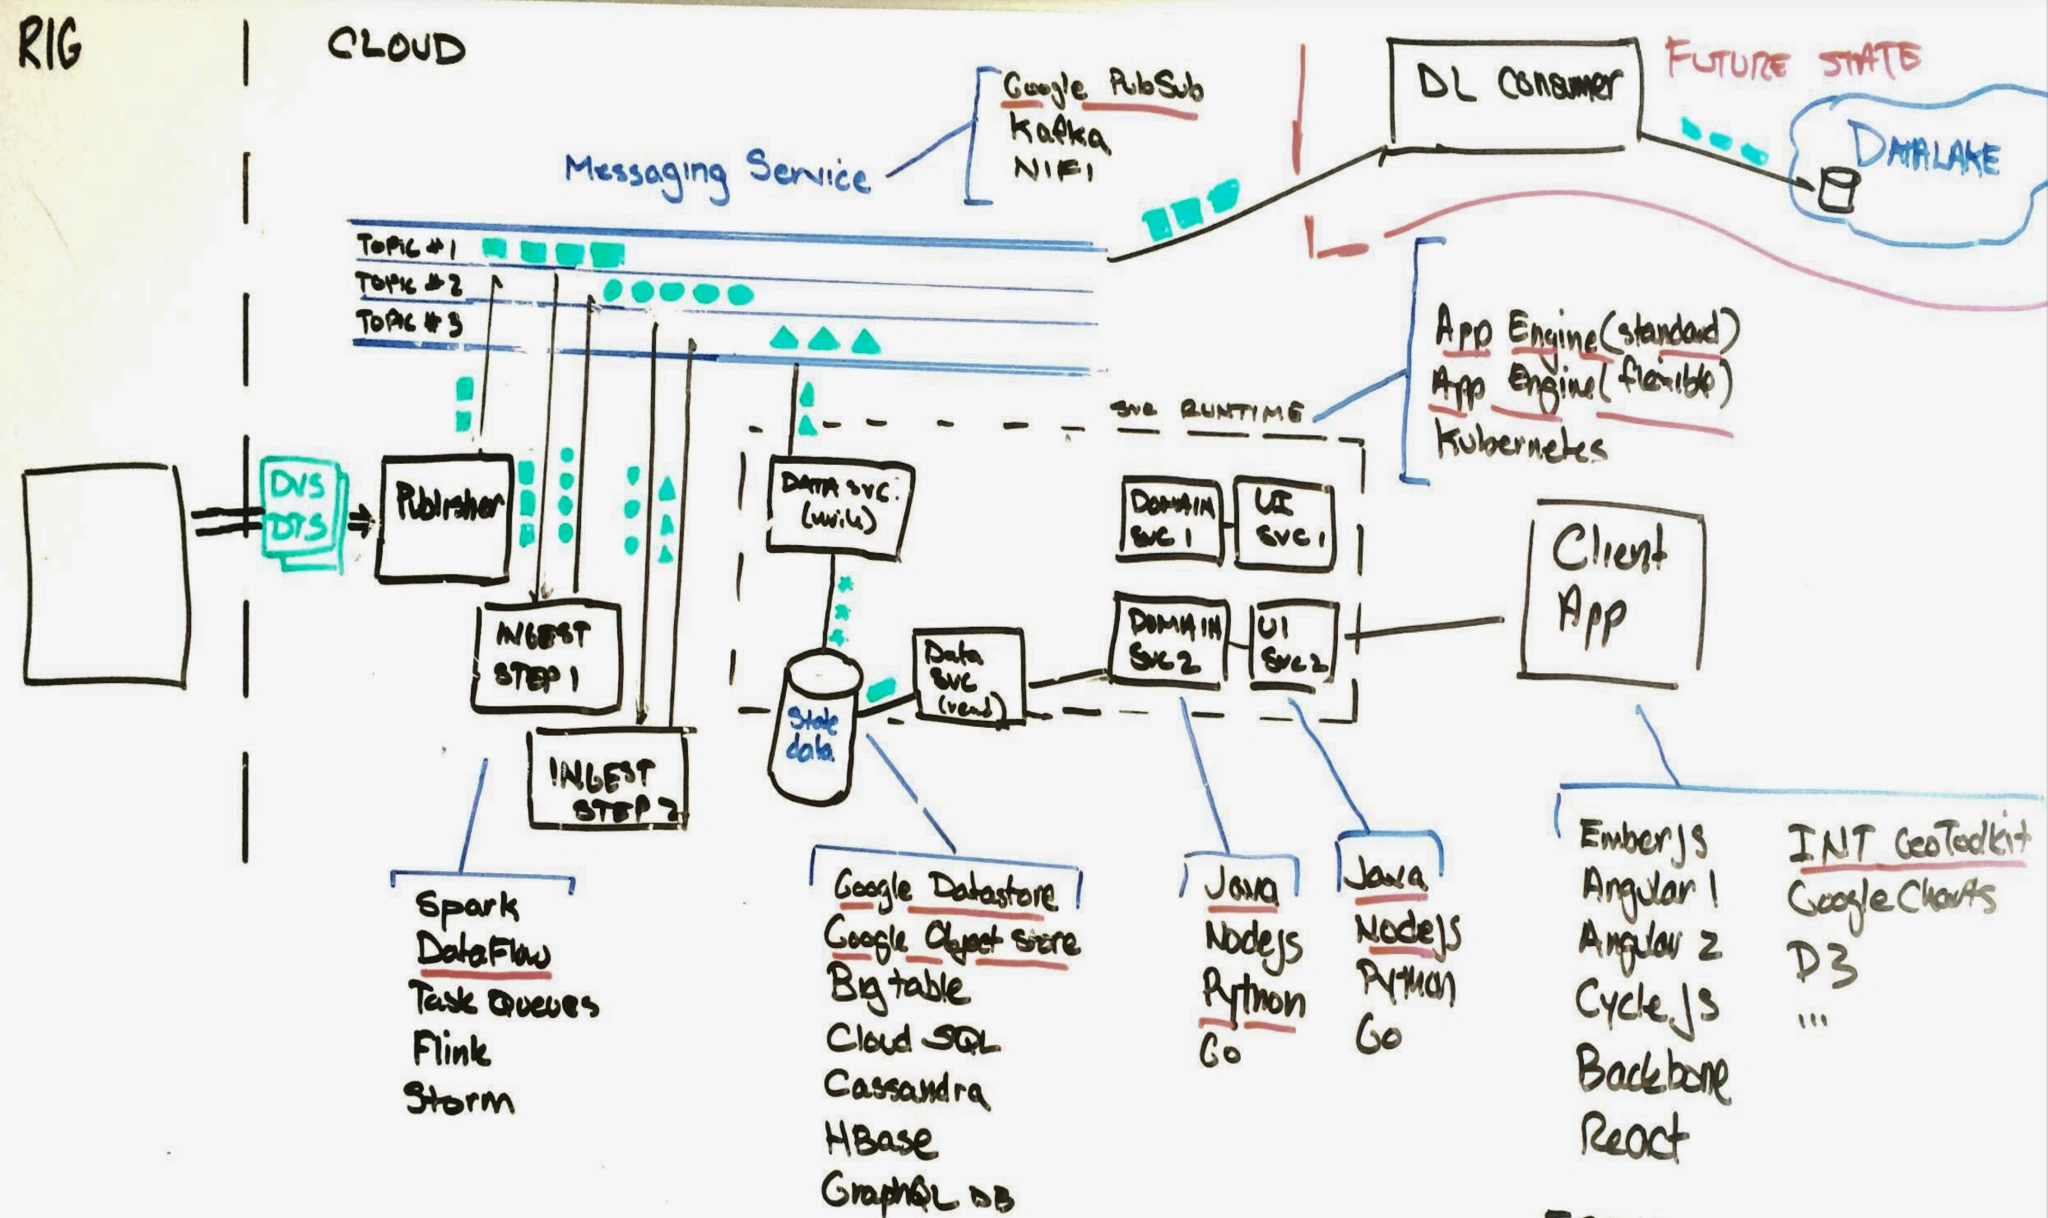
We addressed the challenge of synchronizing fiber and pump data on a common time axis, ensuring that real-time operational insights could be effectively leveraged for fast and accurate decision-making.
Interactive design process
I collaborated closely with my talented colleague, a Business Analyst, who led facilitation and stakeholder alignment, emphasizing real end-user needs throughout the iterative design process. This approach ensured the interface accurately supported users in exploring data layers such as temperature trends, pressure data, and wellbore activity.
We began our design journey by framing key hypotheses to guide our approach. These hypotheses served as the foundation for engaging all stakeholders across the end-to-end process, uncovering valuable insights that shaped our design solutions.
Hypothesis 1: The team believed that framing digital leadership in the context of business innovation for the program's governance group will provide the information needed to lead an effective digital transformation that enables sustained market relevance.
| Key Insight | Takeaway | |
|---|---|---|
| Leadership Alignment | Digital leadership vision was inconsistently understood across the organization. | Created shared business vision frameworks to align stakeholders. |
| Innovation Focus | Focus on accelerating IT cycle time hindered product innovation. | Emphasized value-driven transformation over rapid feature delivery. |
Hypothesis 2: The team believed that creating a focus point creation interface for the well-integrity specialists will achieve a level of traceability for the client that was not possible before.
| Key Insight | Takeaway | |
|---|---|---|
| Traceability Needs | well-integrity specialists required better tools for creating traceable deliverables efficiently. | Designed a focus point creation interface to improve traceability and reduce time spent on deliverables. |
| Team Collaboration | Lack of embedded UX designers delayed story development. | Embedded UX designers into the team to accelerate design-to-code translation. |
Hypothesis 3: The team believed that visualizing integrated fiber and pump measurements for field engineers will provide the information needed to make effective real-time decisions.
| Key Insight | Takeaway | |
|---|---|---|
| User Needs | Users focused on specific wellbore segments and relied heavily on temperature and pressure data for decision-making. | Developed segment-level exploration interfaces with synchronized temperature and pressure data visualizations. |
| Data & Context | Synchronized fiber and pump data were essential, and waterfall views provided critical context. | Implemented seamless data synchronization and waterfall visualizations for enhanced contextual understanding. |
| Historical Analysis | Users valued comparisons of current and past fracturing operations. | Integrated historical data review for trend analysis and future planning. |
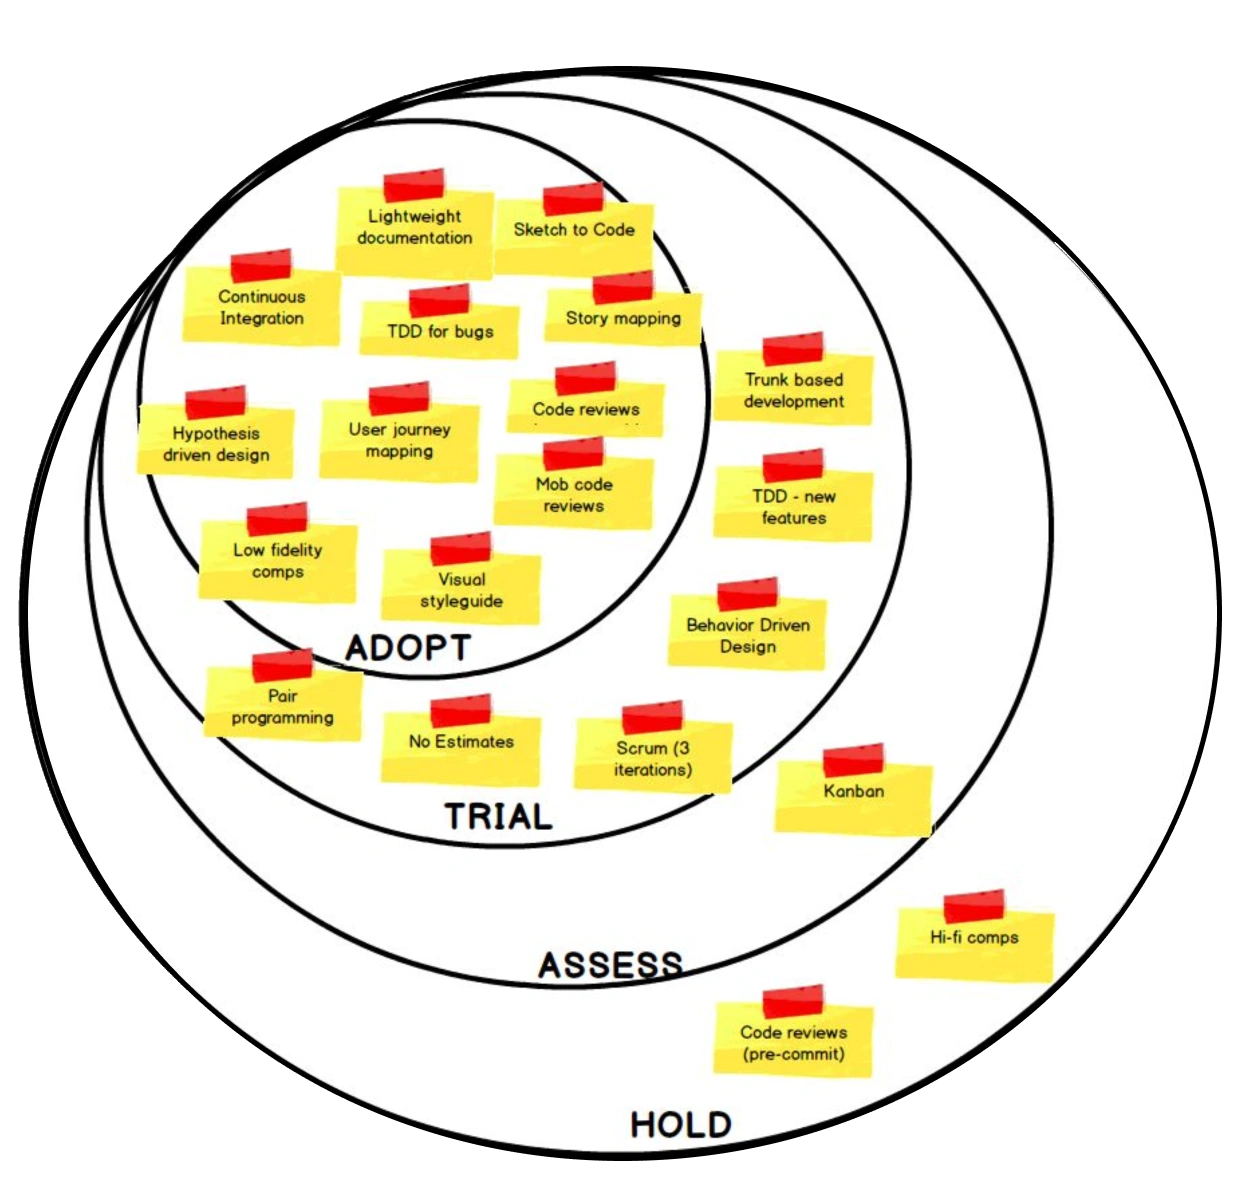
Lean and Agile design practices
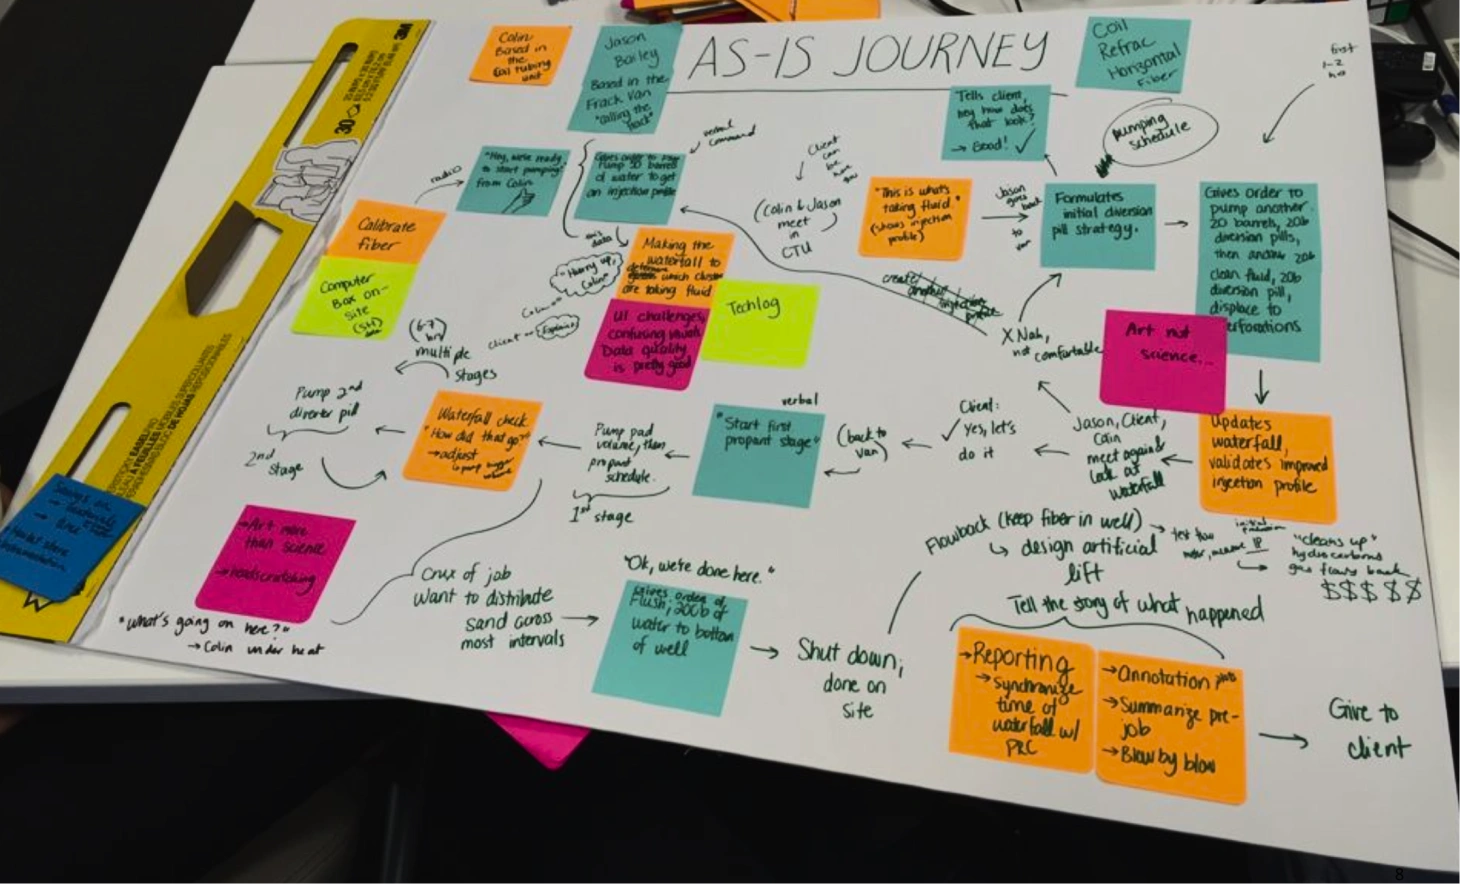
We emphasized iterative methodologies such as “Sketch to Code,” “Hypothesis-Driven Design,” and “User Journey Mapping” to enhance team collaboration and streamline workflows. These Lean and Agile practices enabled rapid prototyping, lightweight documentation, and user-centered solutions, driving efficiency and innovation.
Data logging and playback
Integrated tools for capturing, reviewing, and comparing historical job data to current operations, enabling informed adjustments.
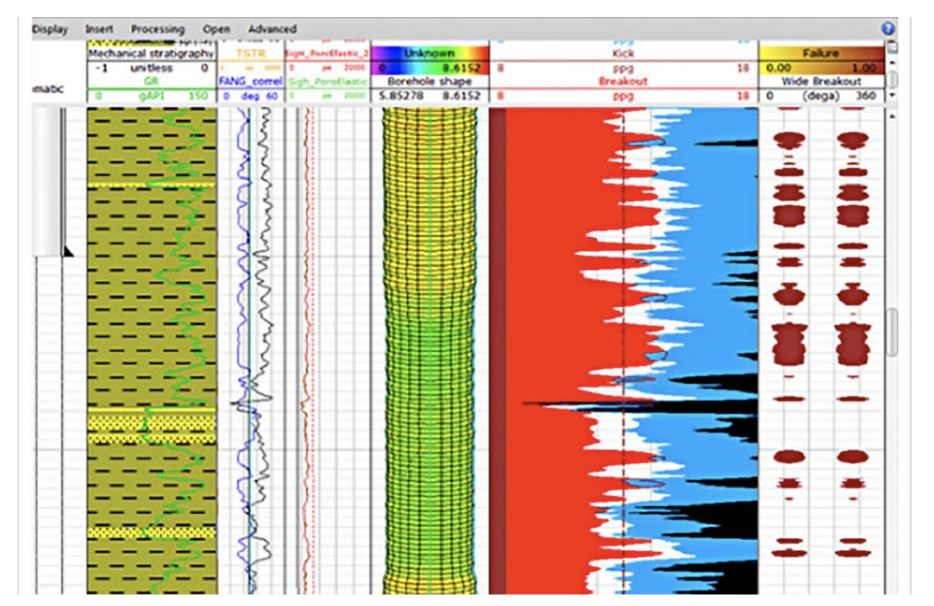
Real-time data visualization
Developed browser-based, synchronized charts and graphs to display integrated fiber and pump data in real time, enabling rapid decision-making.
Results and impact
The interactive prototype demonstrated the transformative potential of real-time data visualization in hydraulic fracturing. By providing actionable insights, the platform reduced decision latency, improved operational accuracy, and enhanced Schlumberger’s ability to innovate. The initiative also reinforced Schlumberger’s commitment to leveraging advanced UX design to meet industrial and sustainability goals.
Challenges and learnings
- Data complexity and visualization: Translating intricate real-time wellbore data into intuitive and actionable visualizations was challenging. This required a deep understanding of user workflows, iterative design testing, and close collaboration with domain experts to ensure usability.
- Real-time performance optimization: Maintaining seamless data streaming and visualization under real-time constraints was crucial. Addressing latency and ensuring high system reliability became a priority to support fast, informed decision-making.
- Effective distributed teamwork: Collaborating across different time zones and locations posed significant communication challenges. The team addressed this by implementing streamlined workflows, clear documentation, and frequent check-ins to align on goals and ensure cohesion.
"Rajveer brings immense value through his deep design expertise, his talents in both UX design and front end engineering, and his servant leadership approach to working with others. I admire how Rajveer is always learning and applying new concepts to his craft, and I value how quickly Rajveer can get concepts into tangible designs or prototypes. On top of that, Rajveer is truly a joyful and kind person to work with - he is well liked and respected by his peers and stakeholders alike."