Empowering retail precision at 84.51° for Kroger
A transformative redesign of campaign analytics at 84.51° for Kroger, delivering a scalable platform for real-time insights. Prism streamlined processes, empowered stakeholders, and set new standards in retail marketing precision.
- 3500+
- data signals
- 11x
- return
- #1
- ranked
- 10%
- uplift
To comply with my non-disclosure agreement, I have anonymized and excluded specific information deemed confidential in this case study. The views expressed are my own and do not reflect those of my former employer, ThoughtWorks, or the client, 84.51°.
Background
Kroger, one of the largest grocery retailers in the United States, collaborates with 84.51°, a data analytics and intelligence company, to optimize its operations and marketing strategies. 84.51° serves as an intelligence engine, leveraging consumer data to help Kroger and its CPG partners make informed decisions about promoting their products.
-
- Manual processes
- Partnership Managers and analysts spent excessive time on manual tasks, from data pulling to report compilation, slowing down client response times.
-
- Delayed insights
- Campaign evaluations took months to complete, preventing timely decision-making and strategic adjustments for ongoing campaigns.
-
- Limited visibility
- CPGs lacked access to in-flight campaign performance metrics, making it impossible to optimize strategies based on real-time data.
-
- System limitations
- While Tableau enabled basic campaign metric visualization, its heavily manual nature created inefficiencies that frustrated both internal teams and CPGs.
For example, CPGs like large national brands use 84.51° insights to design campaigns that target the right audience segments, driving sales and customer engagement on Kroger’s platform. This unique relationship creates a symbiotic ecosystem where 84.51° provides advanced analytics, and Kroger offers the platform and customer base.
These challenges highlighted the urgent need for a unified, user-centric platform, setting the stage for the PRISM platform initiative:
Vision
“Create a single destination in Prism for people to evaluate their media investments with 84.51° in order to choose the most personalized way to connect with and deliver value for our Customers and Clients.”
My role
As a ThoughtWorks consultant, I was brought in to lead UX and design engineering for the Prism analytics workstream at 84.51°. My role was twofold:
- To elevate and mature the design and collaboration practices at 84.51°.
- To support the ongoing initiative of transitioning from legacy systems like Tableau to Prism, a next-generation platform aimed at modernizing how campaign performance data is delivered and acted upon.
Core strategy
The project aimed to transition legacy processes into a robust, future-ready platform. As part of the core team, I contributed to fast-tracking this transformation by scaling existing efforts through a collaborative and iterative approach. The strategy focused on:
- Optimize systems and processes: Streamlined workflows and introduced scalable practices, including design thinking and quick feedback loops, to align with agile delivery goals.
- Take existing KPM measurement online: Transitioned from manual, hand-delivered reporting to an automated, online system for greater efficiency and accessibility.
- Enable real-time insights: Delivered in-campaign reporting for off-site media metrics, empowering stakeholders to make timely adjustments during campaign execution.
Getting started
My initial focus was on understanding the current ecosystem, workflows, and project goals. To achieve this, I:
- Conducted a thorough review of existing user research, insights, and project documentation.
- Collaborated with stakeholders, analysts, and designers to validate my understanding of the as-is journey and highlight any gaps or inefficiencies.
- Facilitated workshops to map out existing workflows, align on priorities, and ensure shared clarity on objectives.
- Identified key areas for improvement in collaboration, processes, and system workflows, setting the stage for accelerating progress.
Mapping the as-is journey
From day one, I paired with an in-house designer who had been deeply involved in the initiative. His multi-skilled expertise in front-end development, design, and product mindset made him an excellent collaborator. This partnership, built on mutual respect and learning, set the tone for strong collaboration throughout the project.
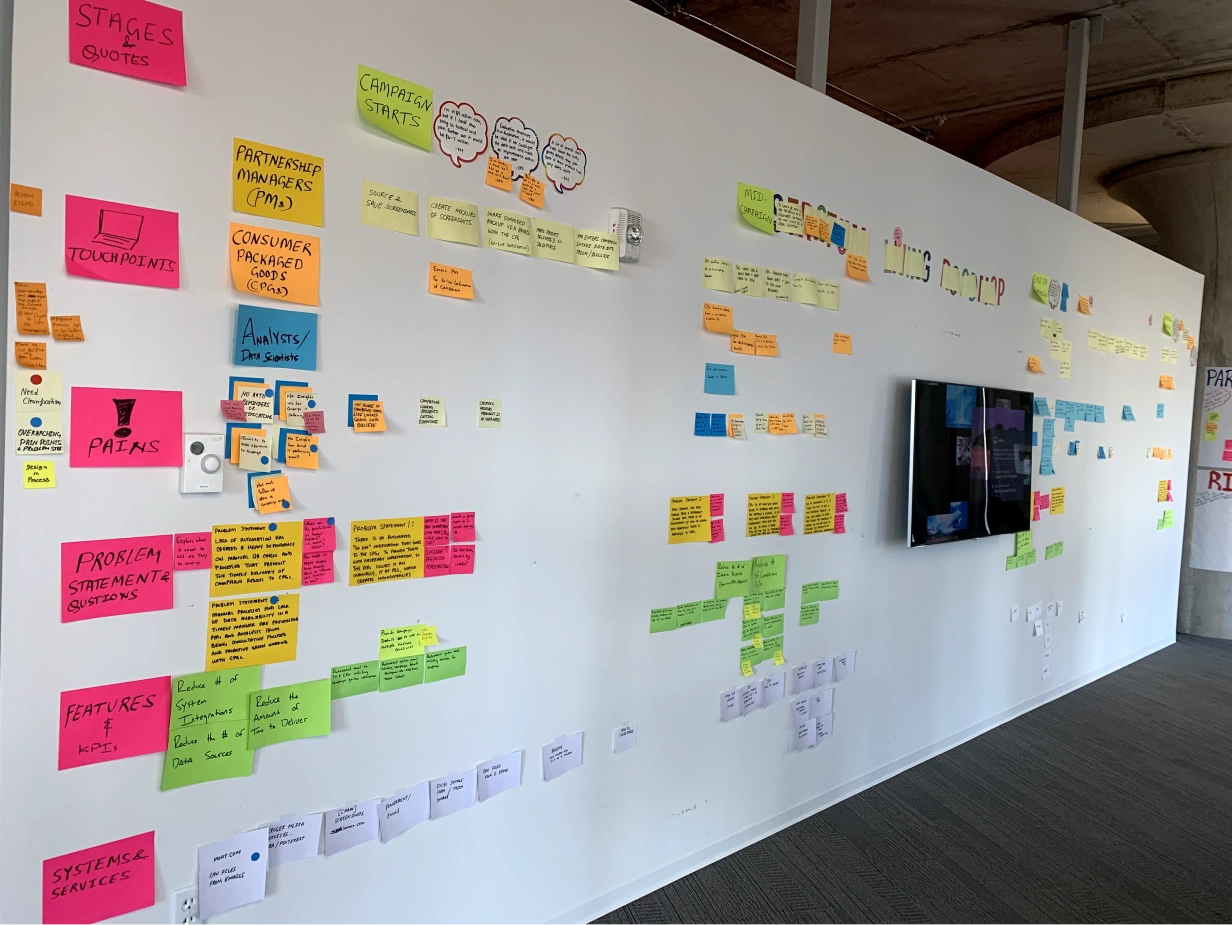
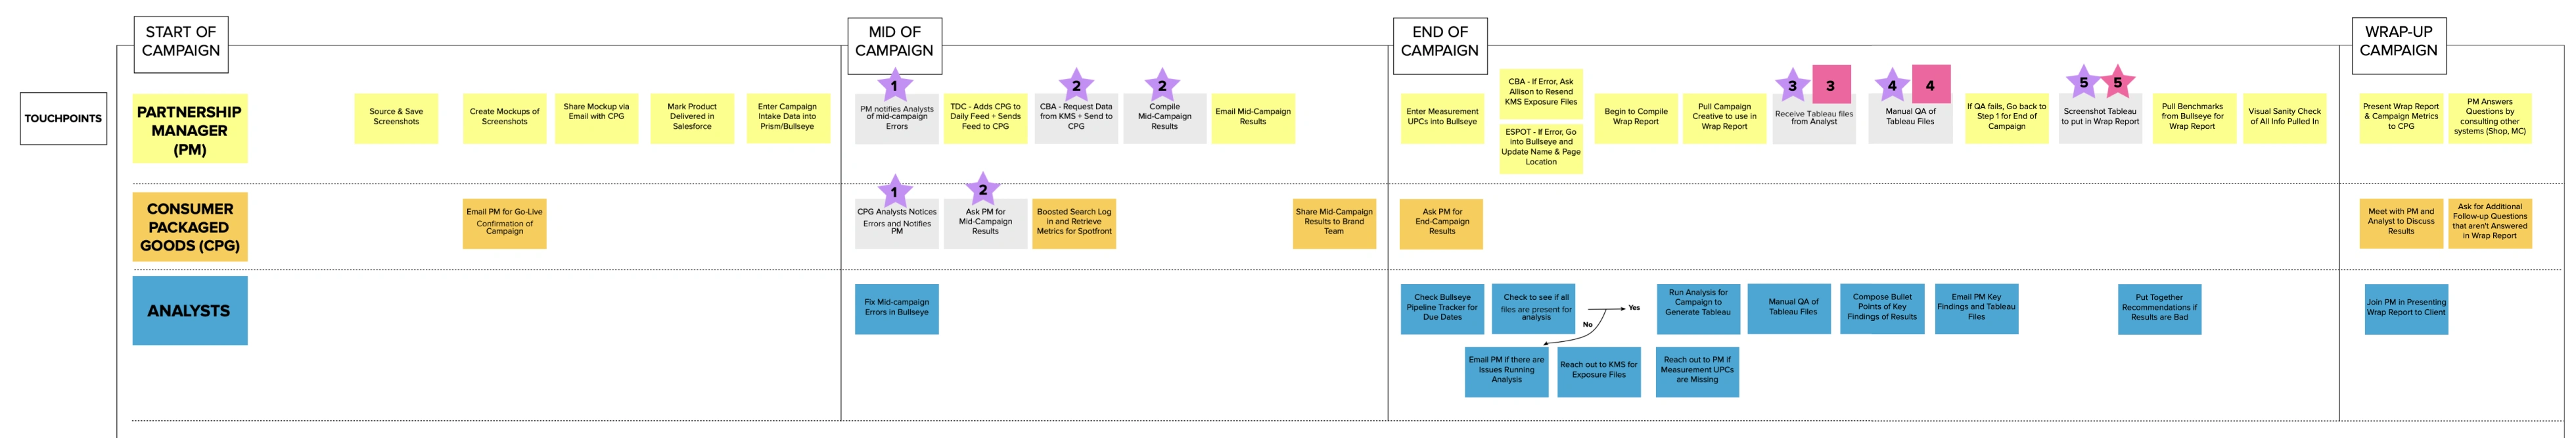
Together, we facilitated an intensive exercise to map the as-is user journey and inflow. This initiative involved:
- Collaborative input: Engaging BAs, tech leads, developers, and stakeholders to contribute insights from their areas of expertise.
- Visualizing workflows: Developing a comprehensive wall visualization of existing processes to clarify the current state and create a shared understanding.
- Identifying gaps: Encouraging discussions that highlighted overlooked challenges and validated ongoing efforts.
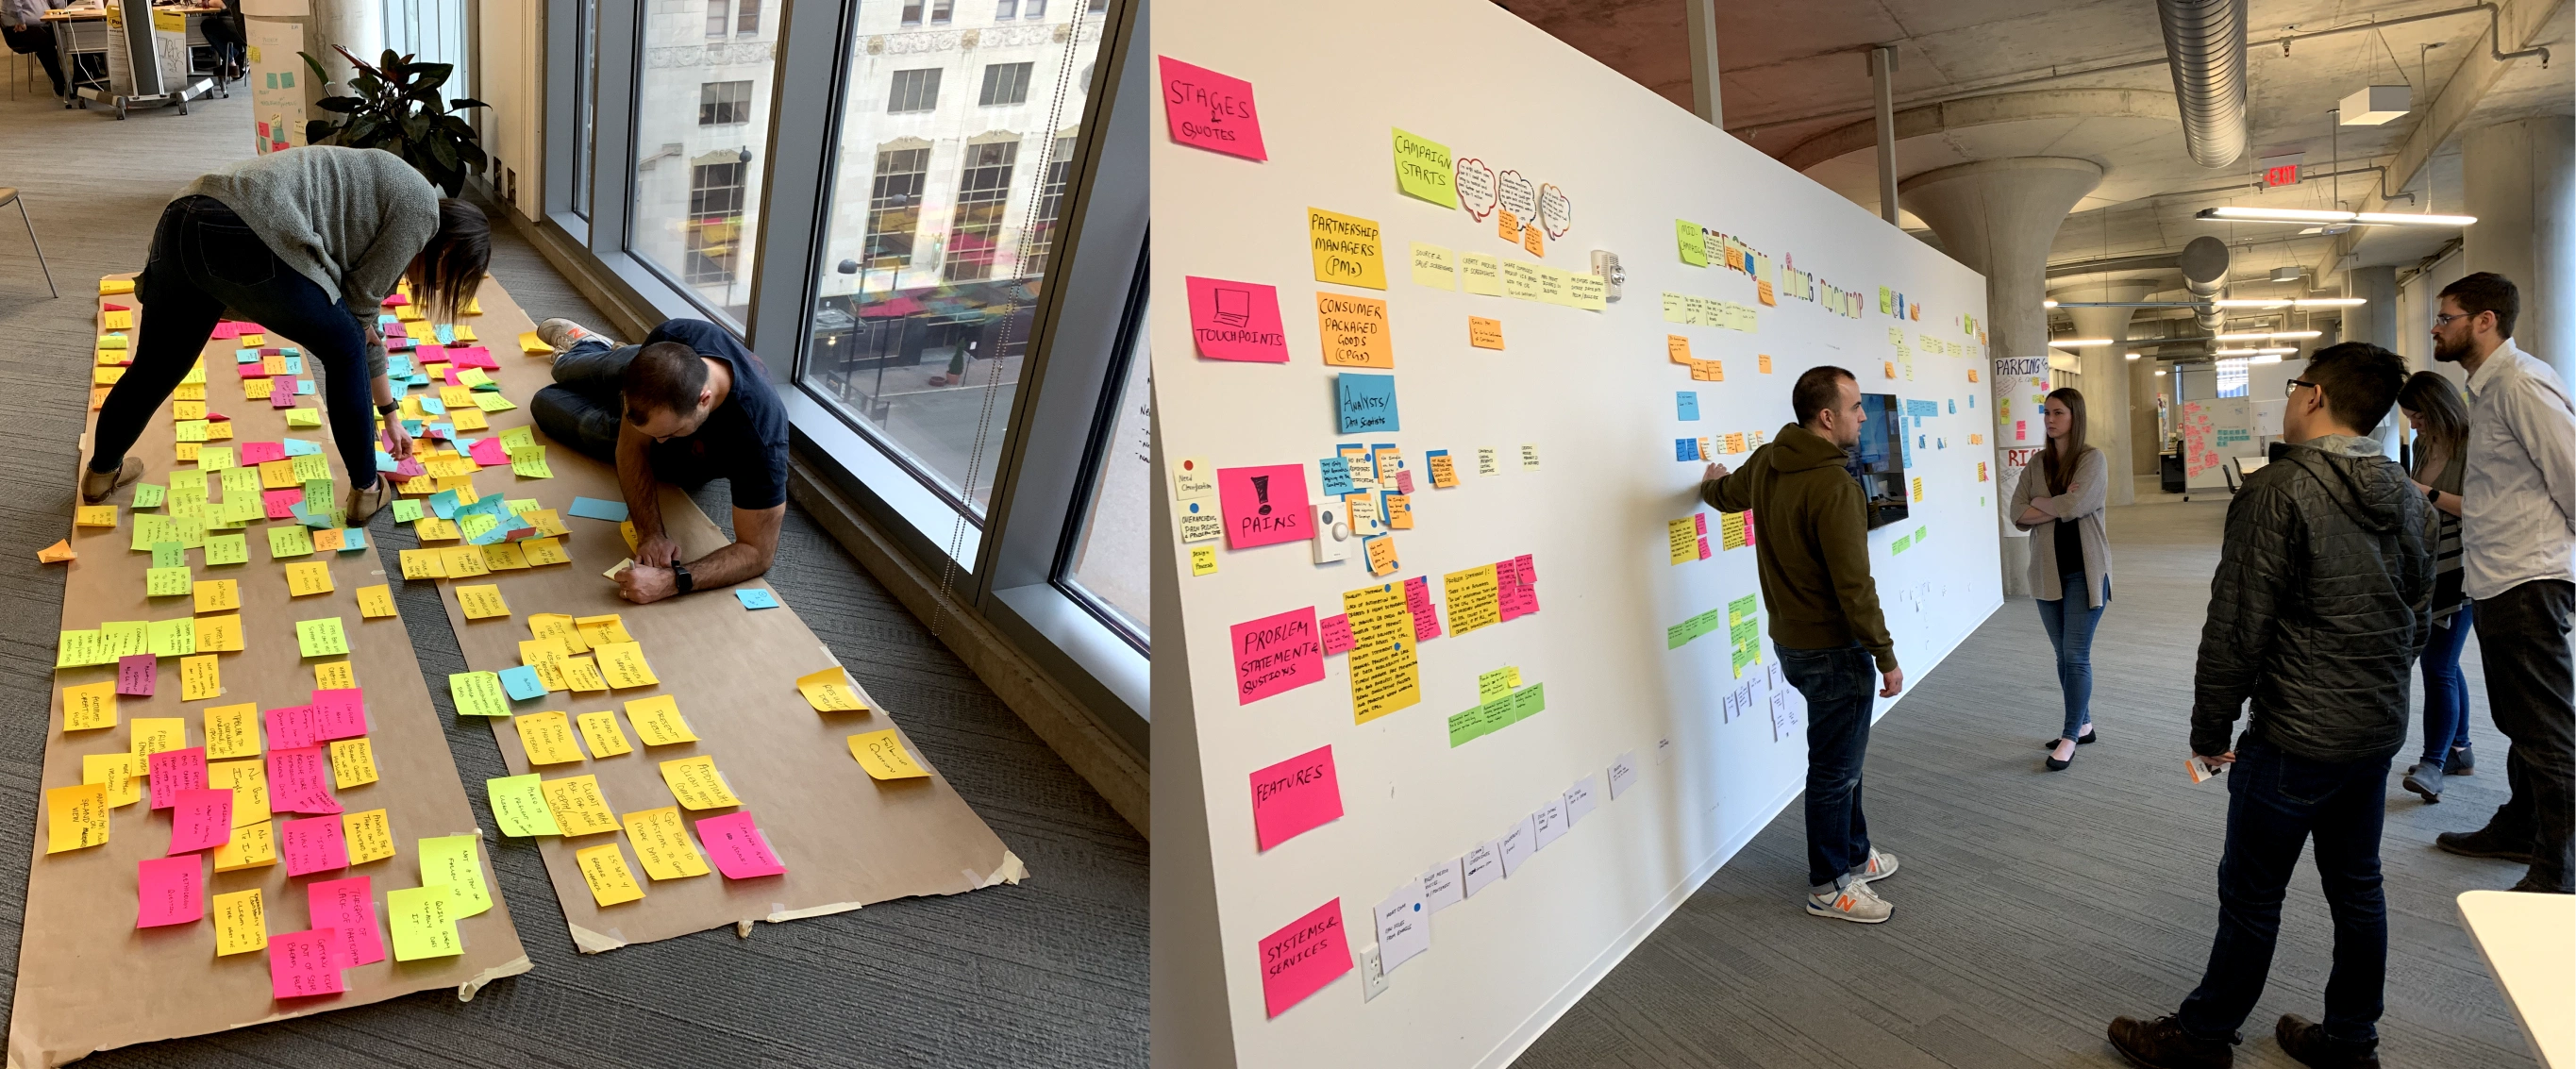
Once we reached a point of satisfaction with the as-is journey, having it thoroughly reviewed and endorsed by all involved, we digitized the final version. This digital format became a valuable reference artifact for scrum cycles, user stories, and ongoing team alignment, ensuring continuity and clarity throughout the project.
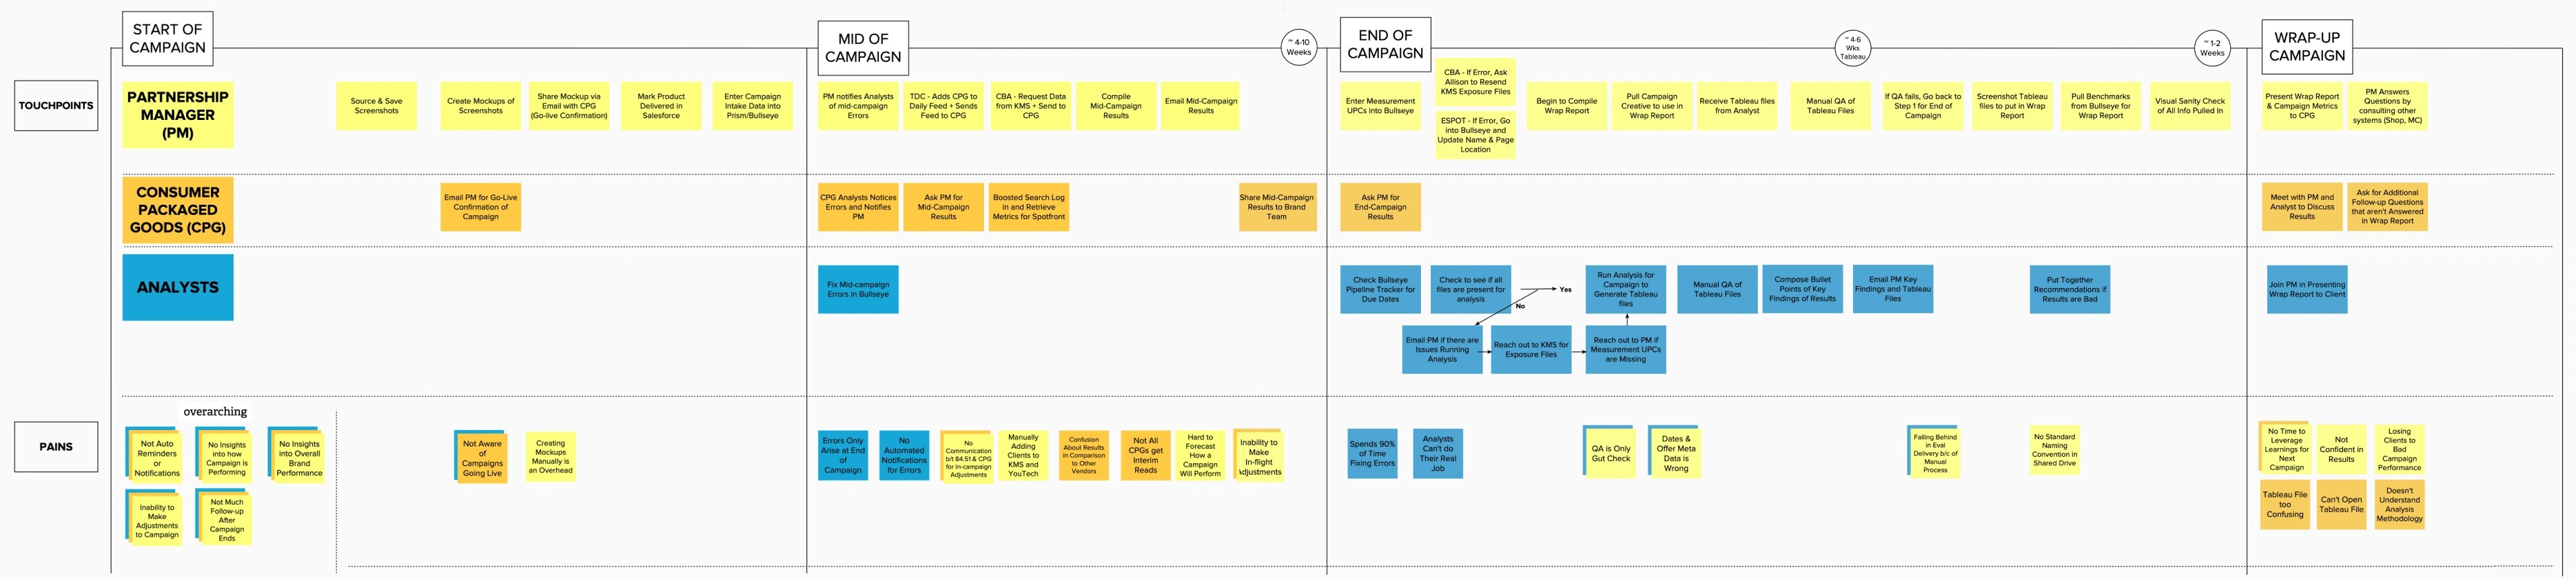
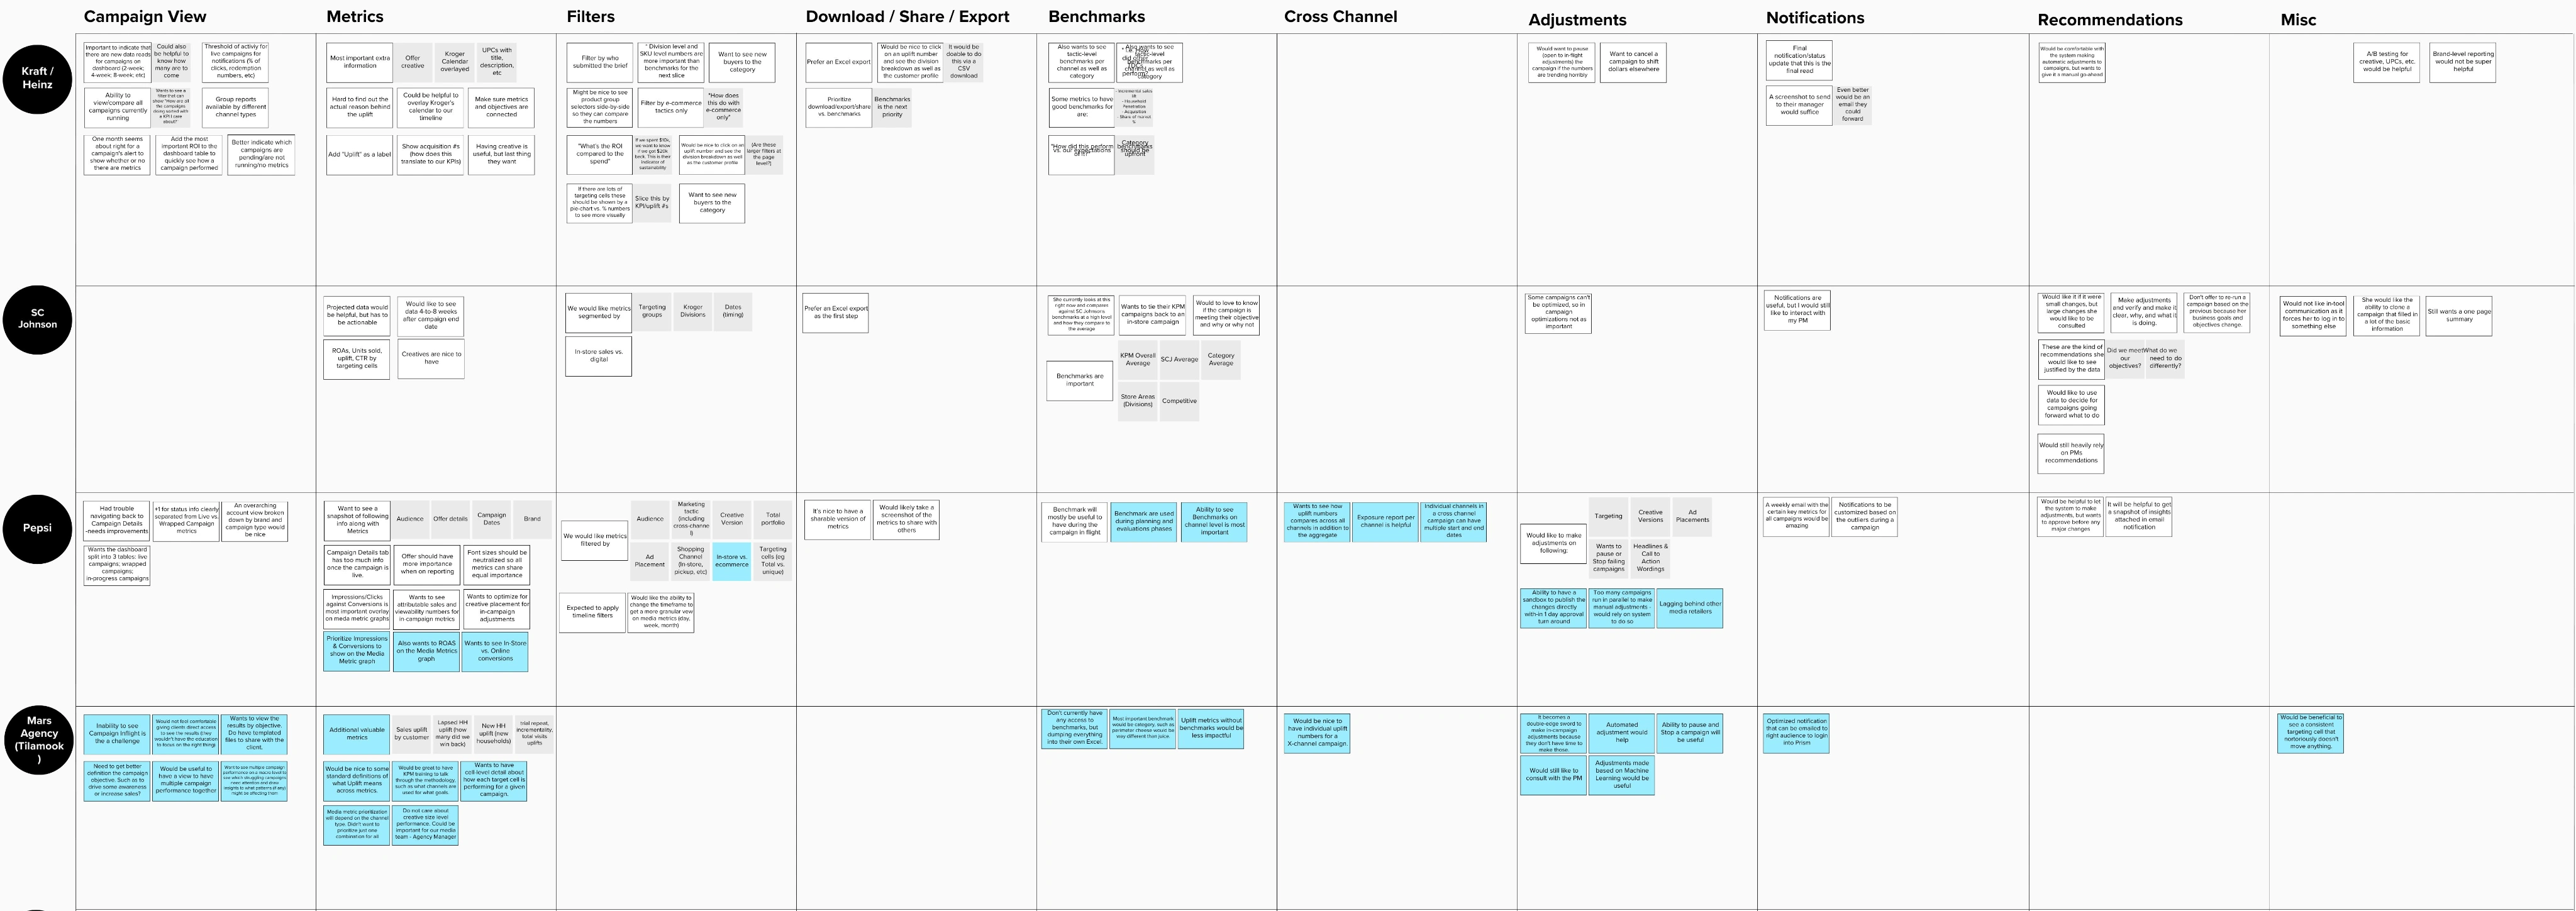
Big themes and gaps
This phase focused on identifying overarching themes and systemic gaps uncovered through collaborative sessions and as-is mapping. These insights were consolidated for the first time into a unified view, providing the team with a structured foundation for discussions, prioritization, and actionable next steps.
- Manual inefficiencies: Many processes relied on manual interventions, causing delays, errors, and frustration across teams. These inefficiencies were exacerbated by a lack of system integrations, leading to repetitive tasks and delays in reporting.
- Lack of autonomy: Stakeholders, particularly CPGs, expressed a strong desire for tools that allowed them to access and analyze data independently. This highlighted the need for self-service capabilities to reduce reliance on intermediaries like PMs or analysts.
- Absence of real-time insights: A recurring theme was the inability to make in-flight adjustments during campaigns due to a lack of real-time data availability. This limitation hindered campaign optimization and impacted decision-making.
- Disjointed workflows: Teams struggled with siloed systems and inconsistent data formats, making cross-functional collaboration more difficult. This misalignment resulted in inefficiencies and delayed insights delivery.
- Scope and metric gaps: Testing highlighted that campaigns executed within Prism could display key metrics such as campaign costs, household reach, impressions, redemption rates, and uplift measures like aROAS or iROAS. However, gaps in these metrics indicated opportunities for better integration and accessibility.
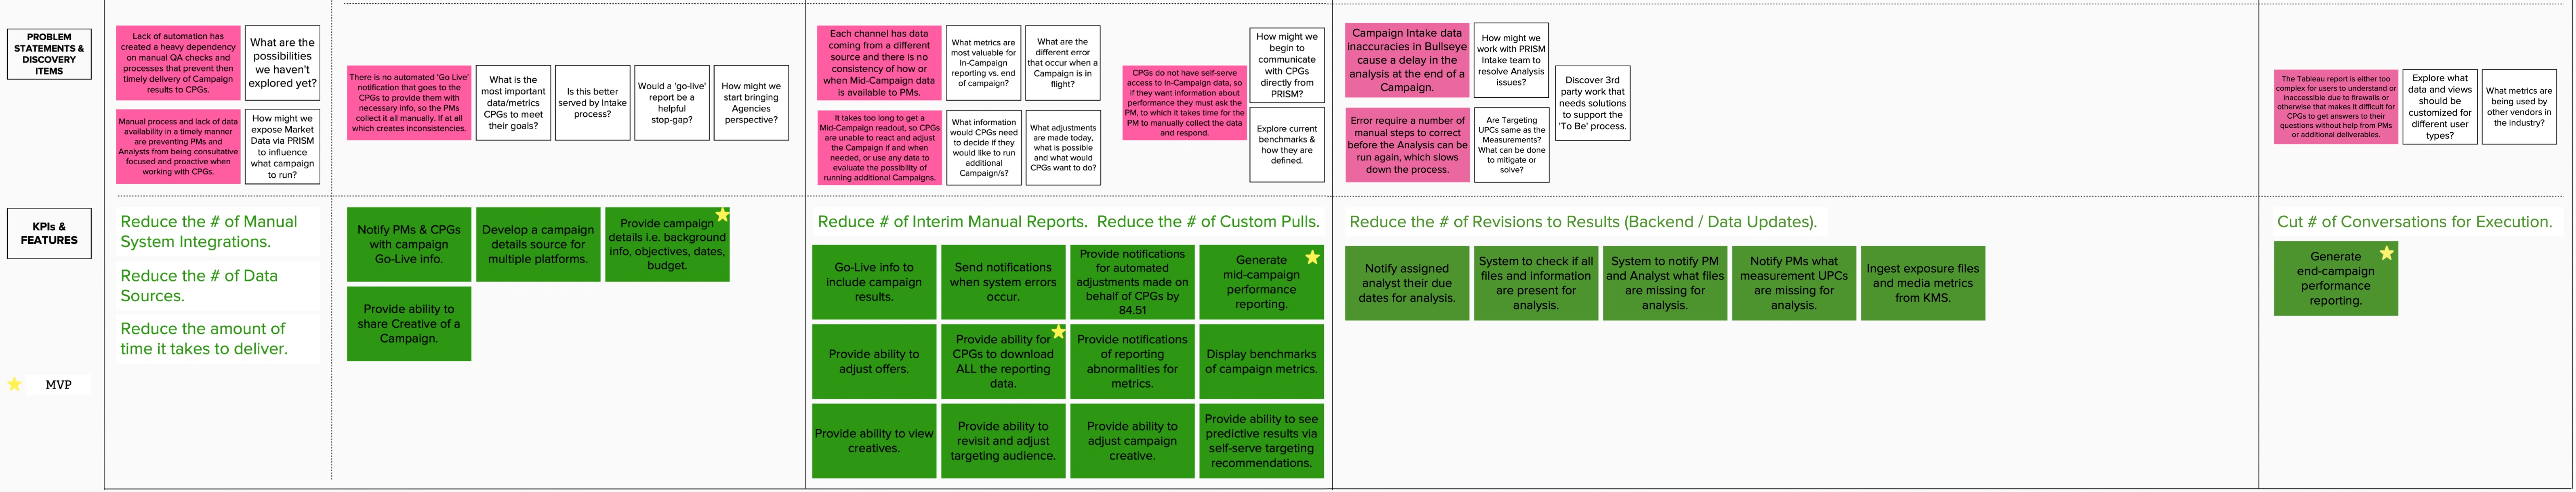
Integrating insights into actionable outcomes
The mapping exercise also illuminated unknowns and raised big questions that needed exploration. Problem statements were paired with KPIs and scoped features, offering the team clarity on what to prioritize:
How might we reduce dependency on manual QA checks and enable PMs to deliver results faster?
What are the most critical metrics that CPGs require to evaluate campaigns effectively?
How can we make in-campaign adjustments actionable, leveraging real-time data?
What metrics need customization for different user types, ensuring relevance across stakeholders?
For the first time, the team had a clear map of where the gaps were and how scoped features aligned with strategic goals, sparking meaningful discussions and collaborations.
These insights became the foundation for defining a to-be user journey flow. By addressing the inefficiencies, autonomy gaps, and lack of actionable insights, the team began aligning on a vision that emphasized scalability, usability, and proactive decision-making.
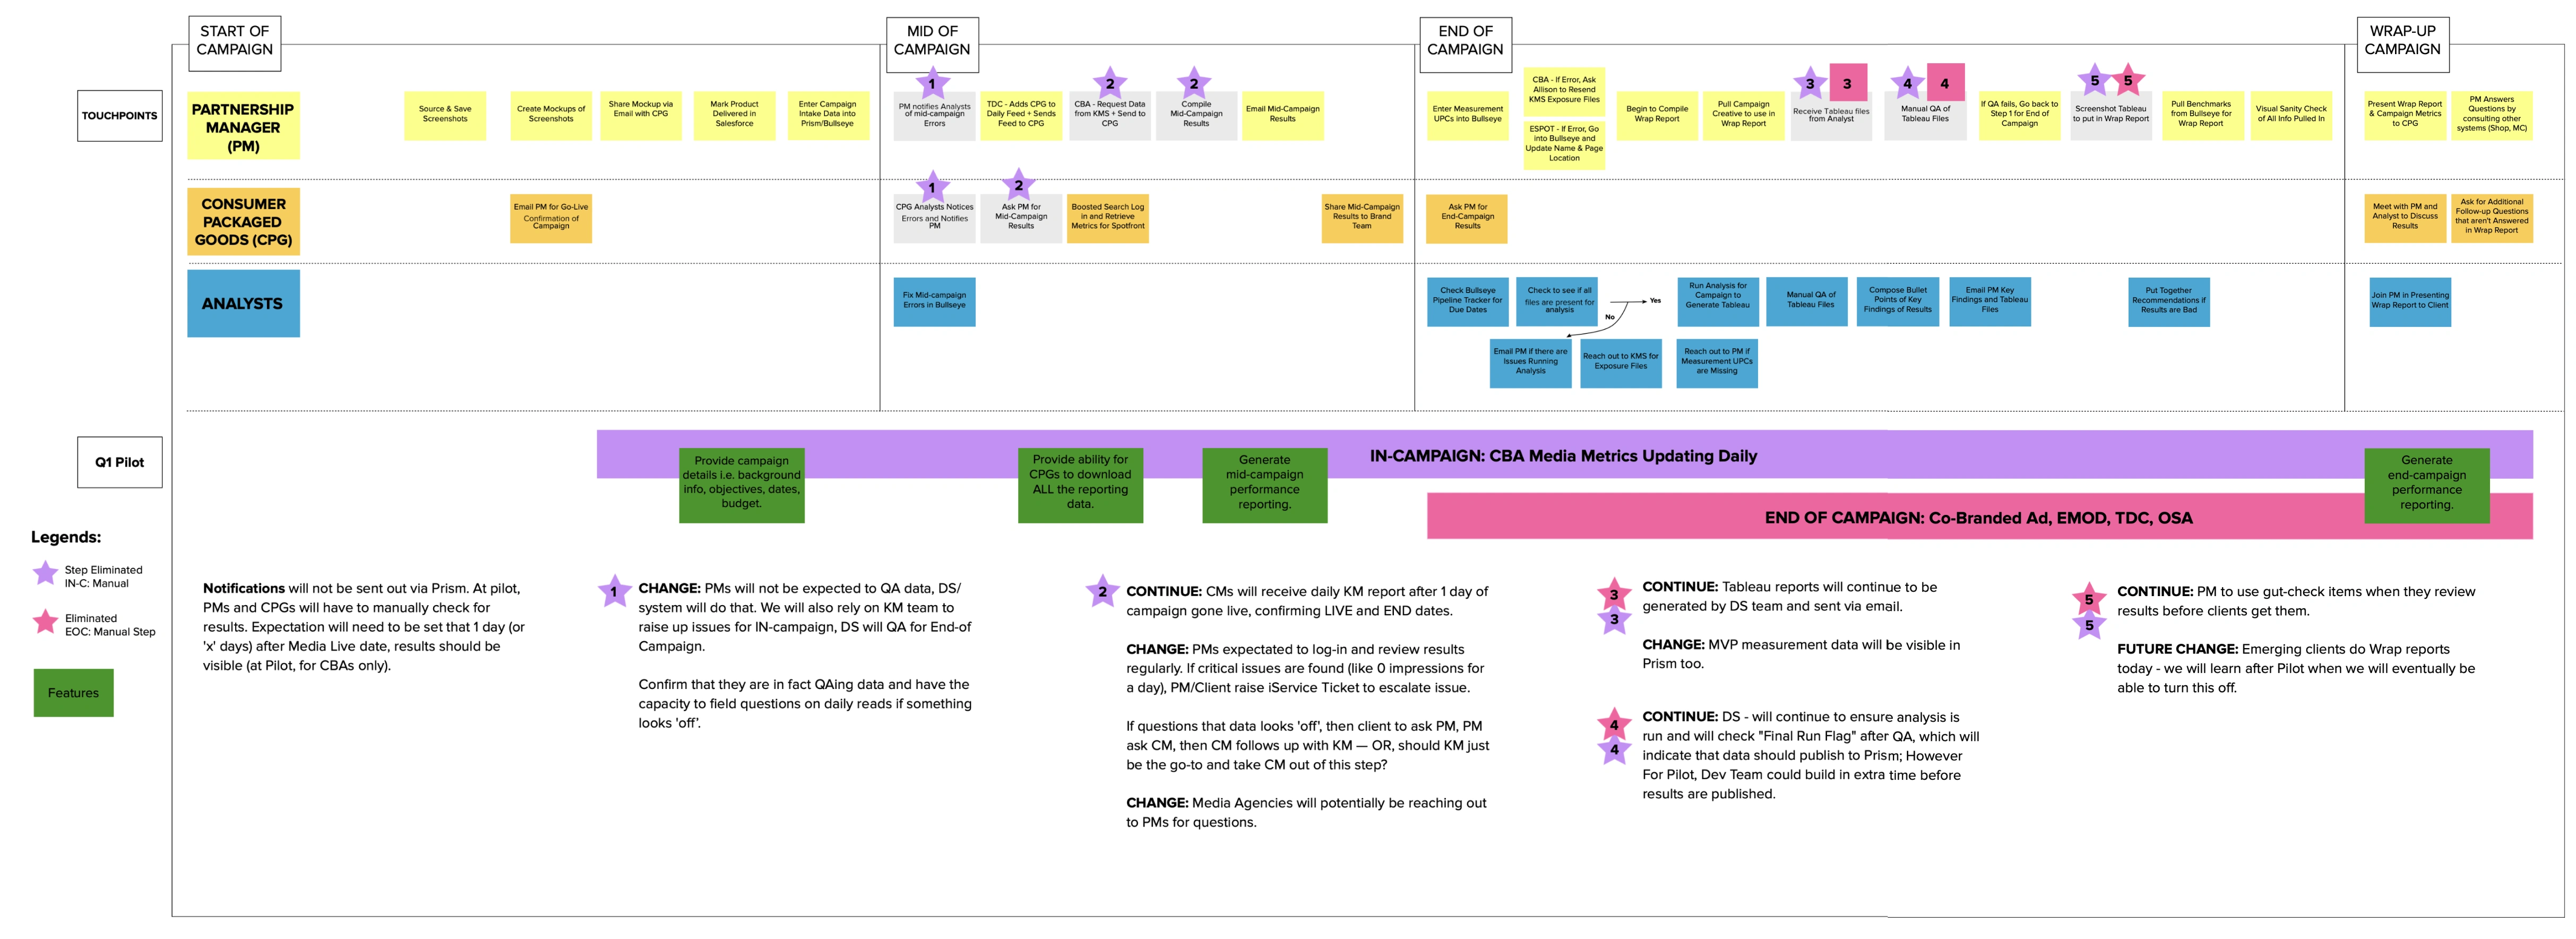
Envisioning the to-be journey
The transition to the envisioned to-be journey focused on solving systemic challenges uncovered during the as-is mapping while laying a foundation for future scalability. This comprehensive effort centered on creating more efficient, user-friendly workflows that empowered stakeholders and drove operational efficiency.
- Streamlined workflows: Manual processes were automated, and system integrations were introduced, eliminating redundant tasks and reducing errors. For instance, repetitive campaign checks and report validations were addressed with dynamic notifications and automated validations.
- Unified data sources: By consolidating disparate tools and platforms, the envisioned journey provided a single source of truth, reducing data discrepancies and fostering stakeholder alignment.
- Proactive adjustments: In-campaign metrics were made accessible in real time, enabling stakeholders to make dynamic adjustments and optimize campaigns based on actionable insights, such as uplift metrics and pacing thresholds.
- User empowerment: Intuitive, self-service tools allowed users, especially CPGs, to directly access performance metrics and make data-driven decisions without relying on intermediaries like PMs.
Highlights of the envisioned to-be journey
- Reimagined campaign management: Automated intake workflows replaced manual data entry, with built-in validation checks minimizing errors and reducing bottlenecks.
- Dynamic decision-making: In-campaign reporting and accessible dashboards provided timely metrics, empowering teams to adjust campaigns on the fly and address emerging trends or anomalies.
- Improved QA and consistency: Enhanced QA processes ensured data accuracy at every stage, with integrated systems alerting teams to potential errors and enabling quicker resolutions.
- Enhanced communication and collaboration: Clearer role definitions and automated notifications reduced the need for excessive manual coordination, streamlining interactions across stakeholders.
The to-be journey was designed to be forward-compatible, anticipating future system expansions and evolving user needs. By aligning team priorities with user pain points, this design balanced immediate efficiency improvements with the flexibility to scale and adapt over time.
Prototyping and validation
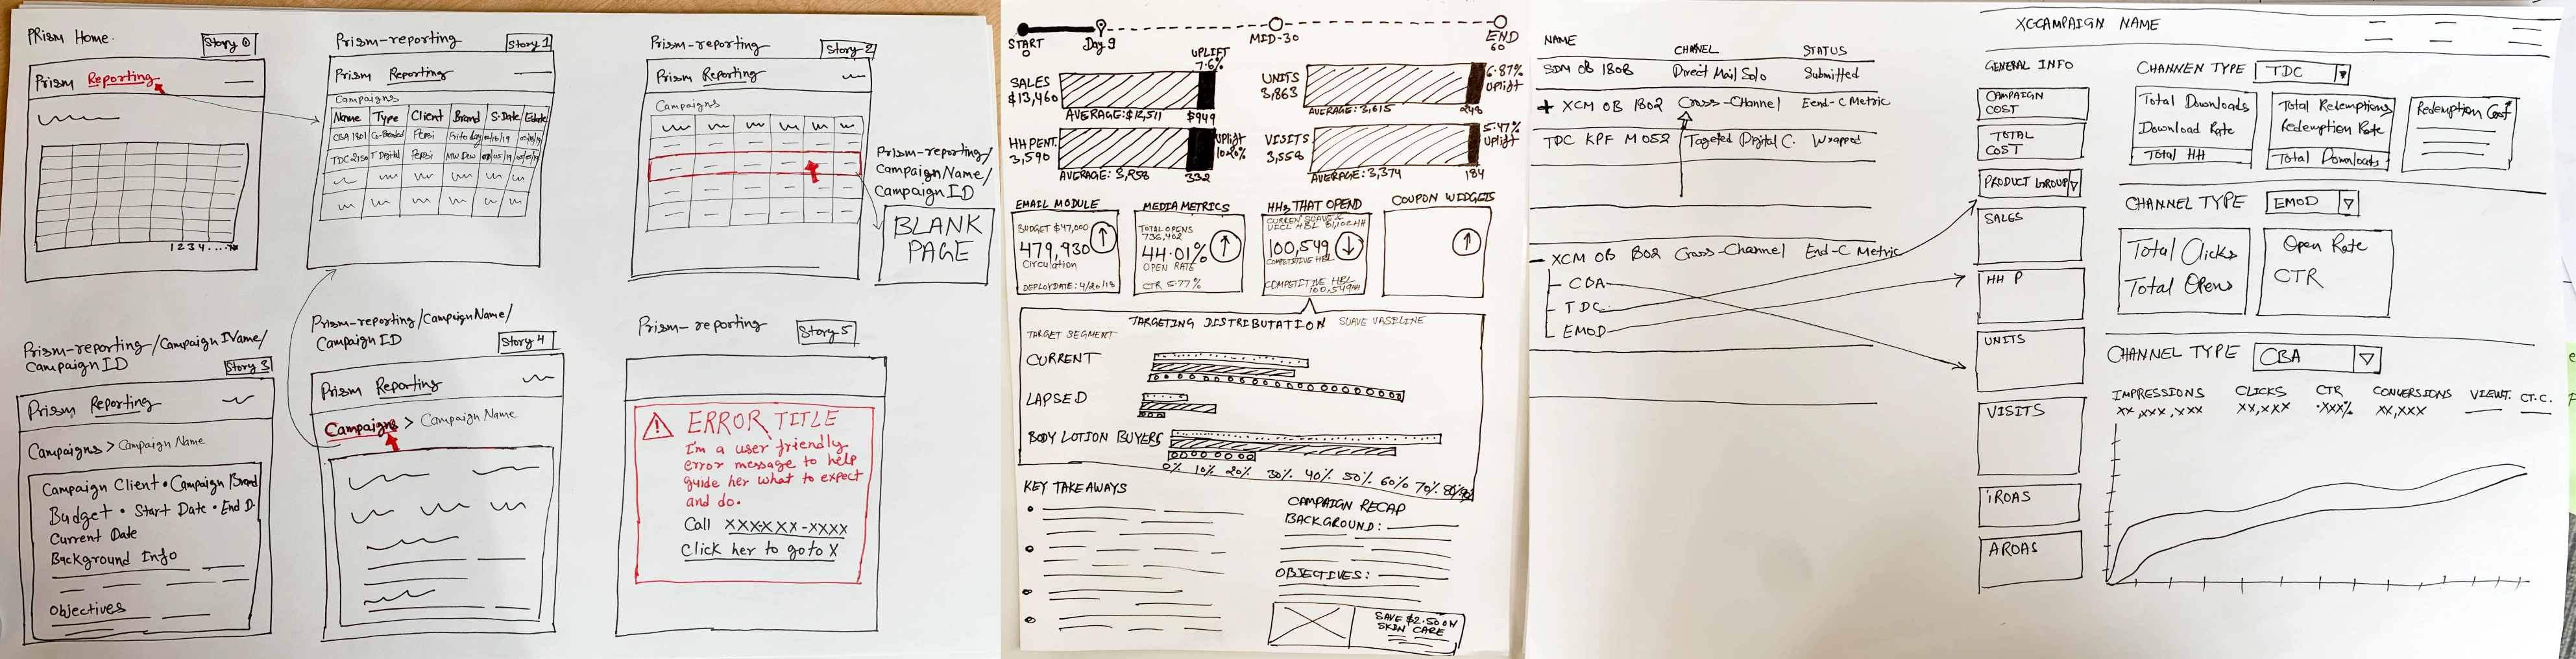
With the insights from the as-is journey mapping and the themes identified, the design team initiated the prototyping phase to bring the envisioned to-be journey to life. Starting with paper prototypes, the process allowed for quick iterations and concept validation before engaging the wider team for feedback and collaboration.
Given the project’s collaborative and iterative nature, paper prototyping was the logical starting point:
- Quick turnaround: Sketching on paper allowed the design team to externalize ideas rapidly without overcommitting to specific solutions.
- Concept validation: Initial prototypes focused on workflows and features to align with the vision while addressing known gaps.
- Collaborative iteration: Once initial versions were created, they were shared with the broader team to gather diverse perspectives and refine ideas collaboratively.
The resulting prototypes reflected the core workflows and features outlined in the envisioned journey, aligning with the identified themes and addressing key user needs. They encouraged constructive feedback from both technical and non-technical stakeholders, fostering a collaborative environment for refining ideas. These tangible artifacts served as a foundation for further iteration and paved the way for developing higher-fidelity prototypes in the next phases.
After incorporating team feedback and suggestions, the prototypes were further refined to better align with the to-be vision. This iterative process ensured that the prototypes were comprehensive while remaining flexible for future development phases.
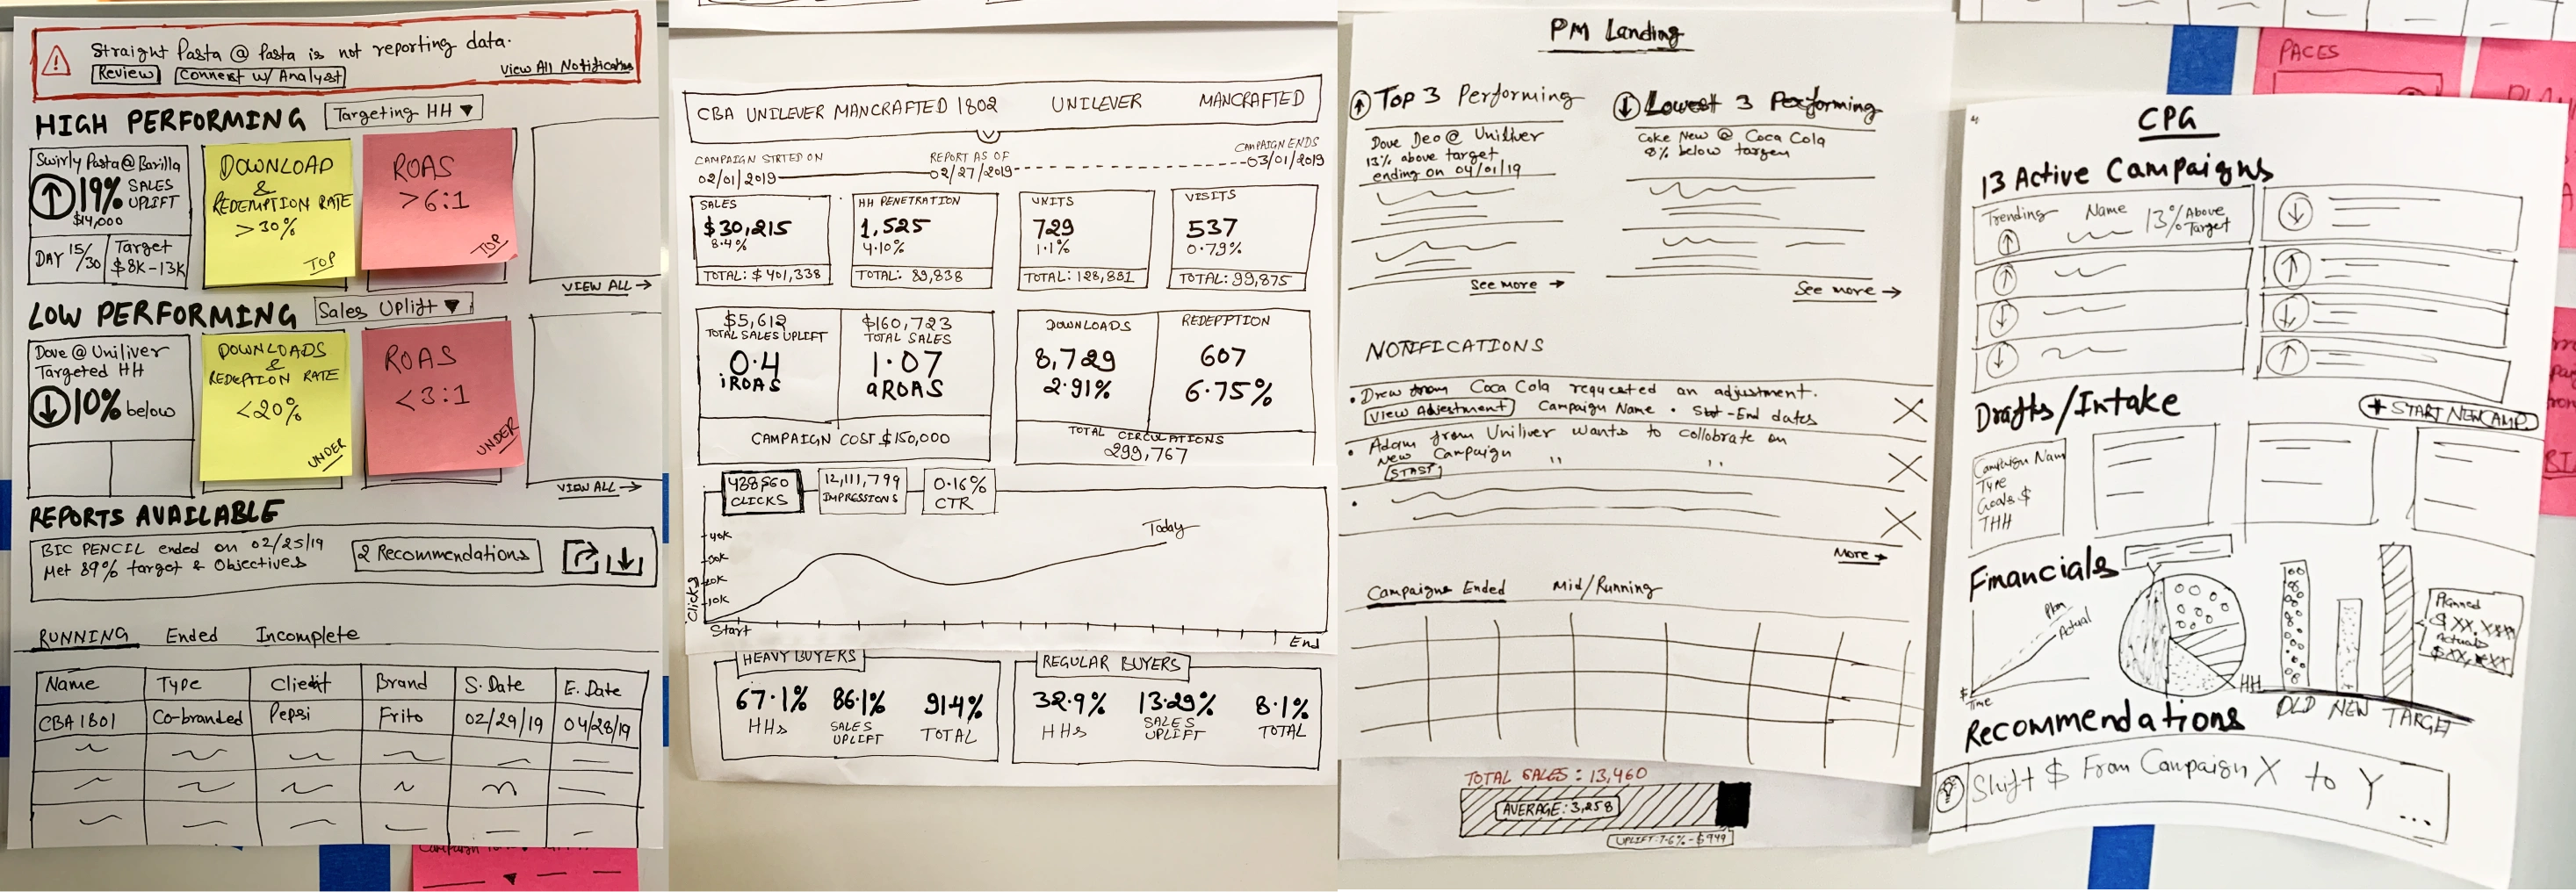
Transitioning to clickable prototypes
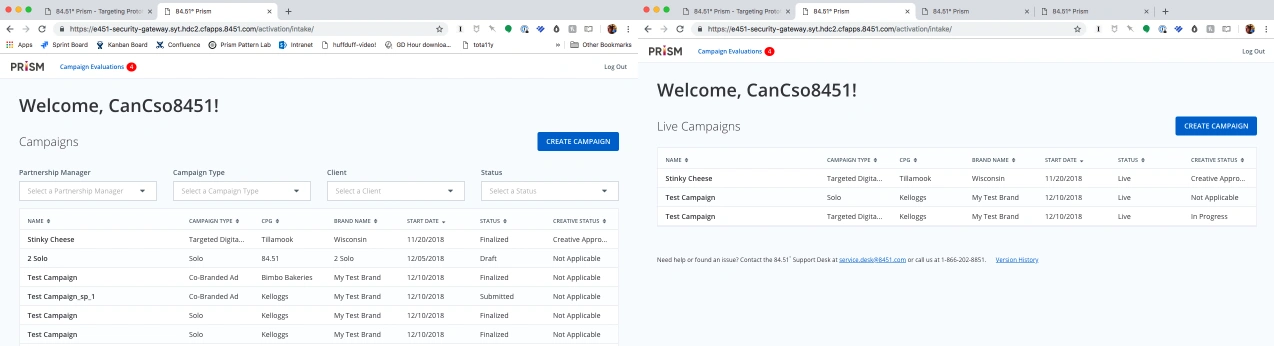
Building on the foundation of paper prototypes, the team transitioned to clickable, low-fidelity prototypes to refine the envisioned to-be journey further and simulate realistic data interactions.
The next phase aimed to bridge the gap between conceptual designs and practical validation. Clickable prototypes allowed the team to:
- Test realistic user flows and data scenarios: Dynamic data inputs ensured the prototypes reflected real-world complexities.
- Validate critical workflows: Scenarios such as error handling, campaign metrics visualization, and navigation were tested in-depth.
- Engage stakeholders effectively: Interactive prototypes closely represented the system's envisioned functionality, providing clarity and driving alignment.
- Simulating realistic data flows: Using JavaScript and JSON, the team created dynamic prototypes to test interactions with campaign metrics.
const campaignData = [ { id: 1, name: "Campaign A", impressions: 12000, clicks: 345, ctr: "2.88%" }, { id: 2, name: "Campaign B", impressions: 8000, clicks: 150, ctr: "1.88%" } ]; const container = document.getElementById('campaign-container'); campaignData.forEach(campaign => { const campaignElement = document.createElement('div'); campaignElement.innerHTML = ` <h3>${campaign.name}</h3> <p>Impressions: ${campaign.impressions}</p> <p>Clicks: ${campaign.clicks}</p> <p>CTR: ${campaign.ctr}</p> `; container.appendChild(campaignElement); }); - Dynamic prototypes: These prototypes supported real-time testing of scenarios such as incomplete data handling and mid-campaign metric adjustments.
- Iterative refinement: Stakeholder feedback was incorporated at each step, ensuring the prototypes met both user needs and project goals.
This process provided a realistic, testable representation of the envisioned workflows, enabling the team to identify and address potential gaps early in development.
User testing and validation
Given the complexity of the product and its diverse user base, the testing phase adopted a variety of methods to capture comprehensive feedback and refine the envisioned workflows. This iterative and continuous approach ensured alignment with user needs and project goals.
- Clickable prototype testing: Low-fidelity clickable prototypes simulated real workflows, navigation, and error-handling scenarios.
In one session, a campaign manager tested a prototype simulating uplift metrics. By comparing acquisition versus retention targeting cells, they validated how filtering by SKUs impacted insights for seasonal campaigns. This led to prioritizing flexibility in SKU-level filtering to support such nuanced use cases.
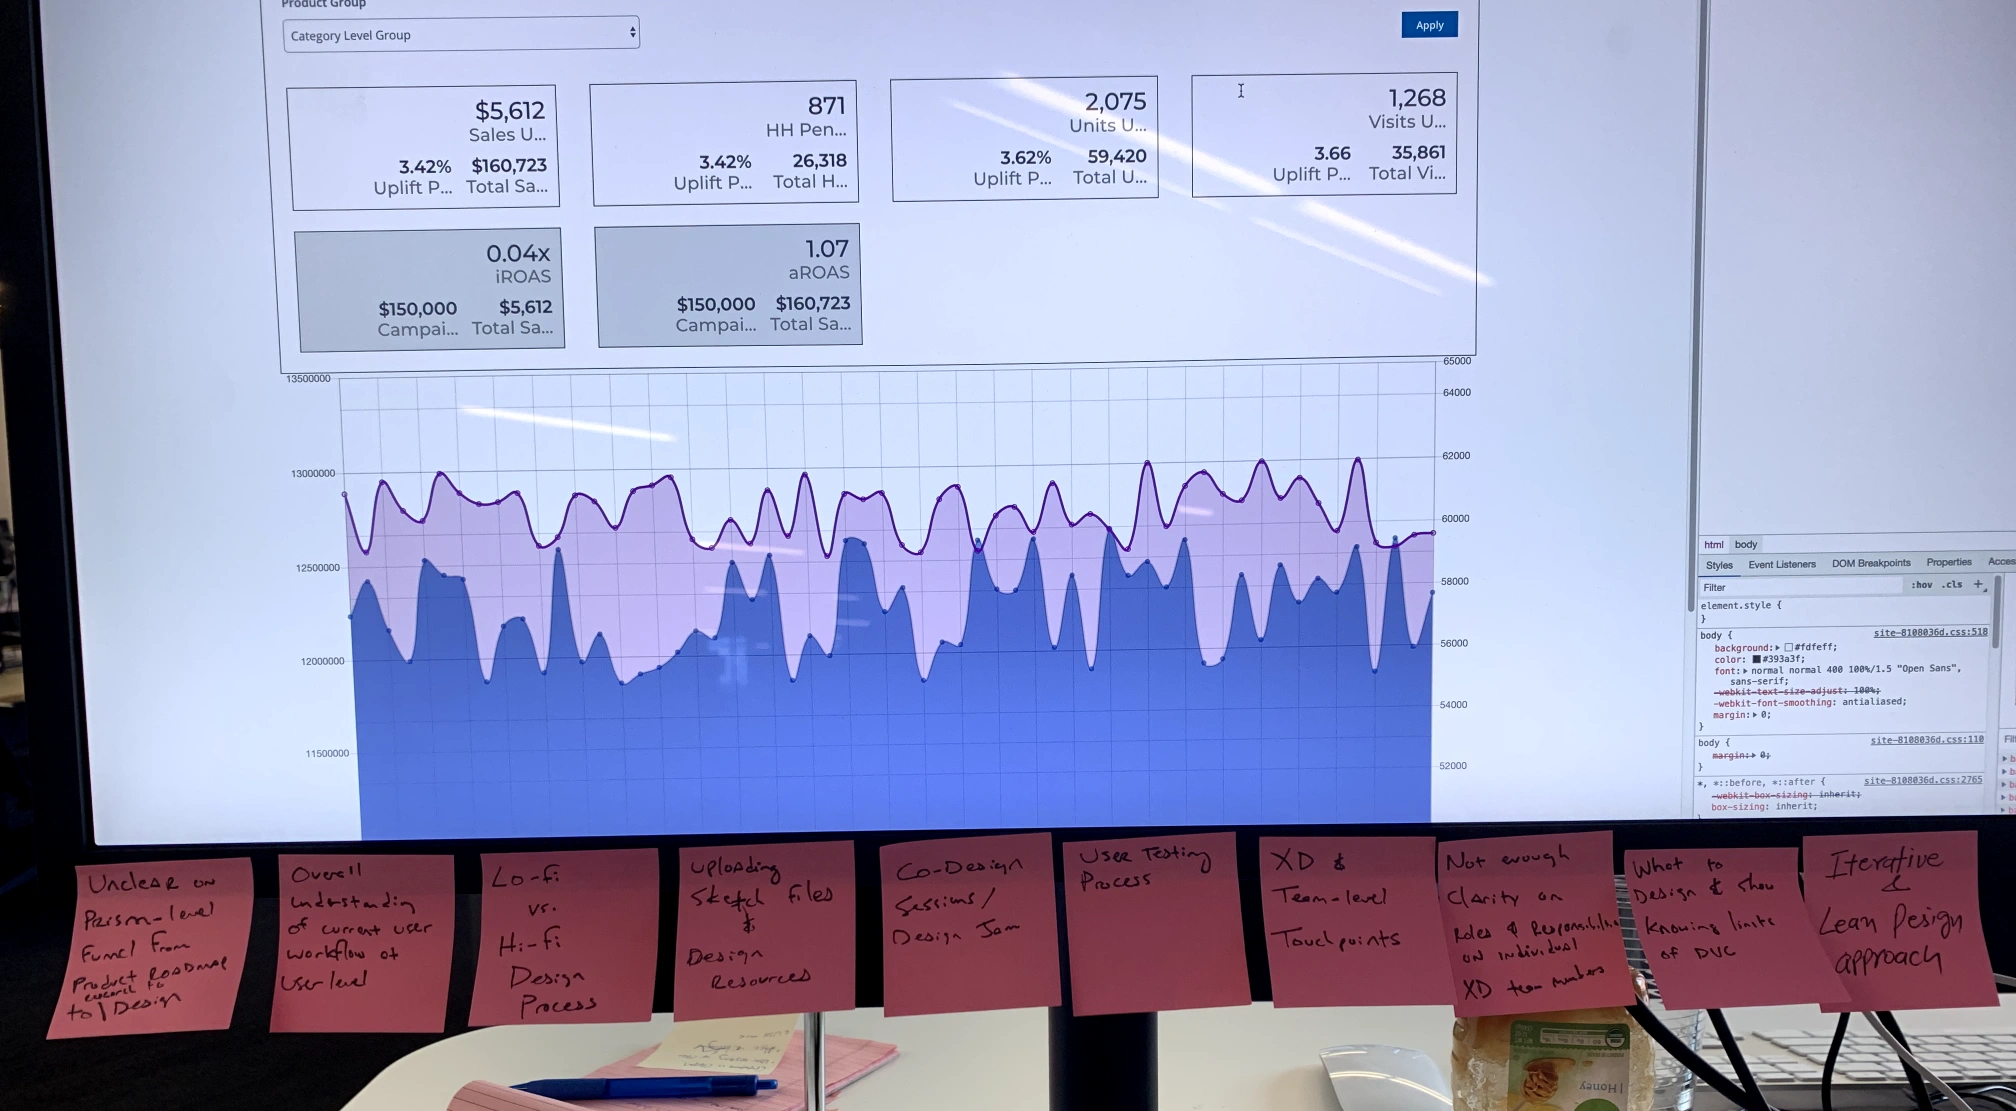
Prototype testing session showing campaign metrics dashboard and design sprint notes, featuring uplift analysis and SKU-level filtering functionalities. - Scenario-driven metric prioritization: Sessions with CPGs, marketing professionals, and reviewers explored how they prioritized metrics like ROI, household penetration, and sales uplift under different conditions.
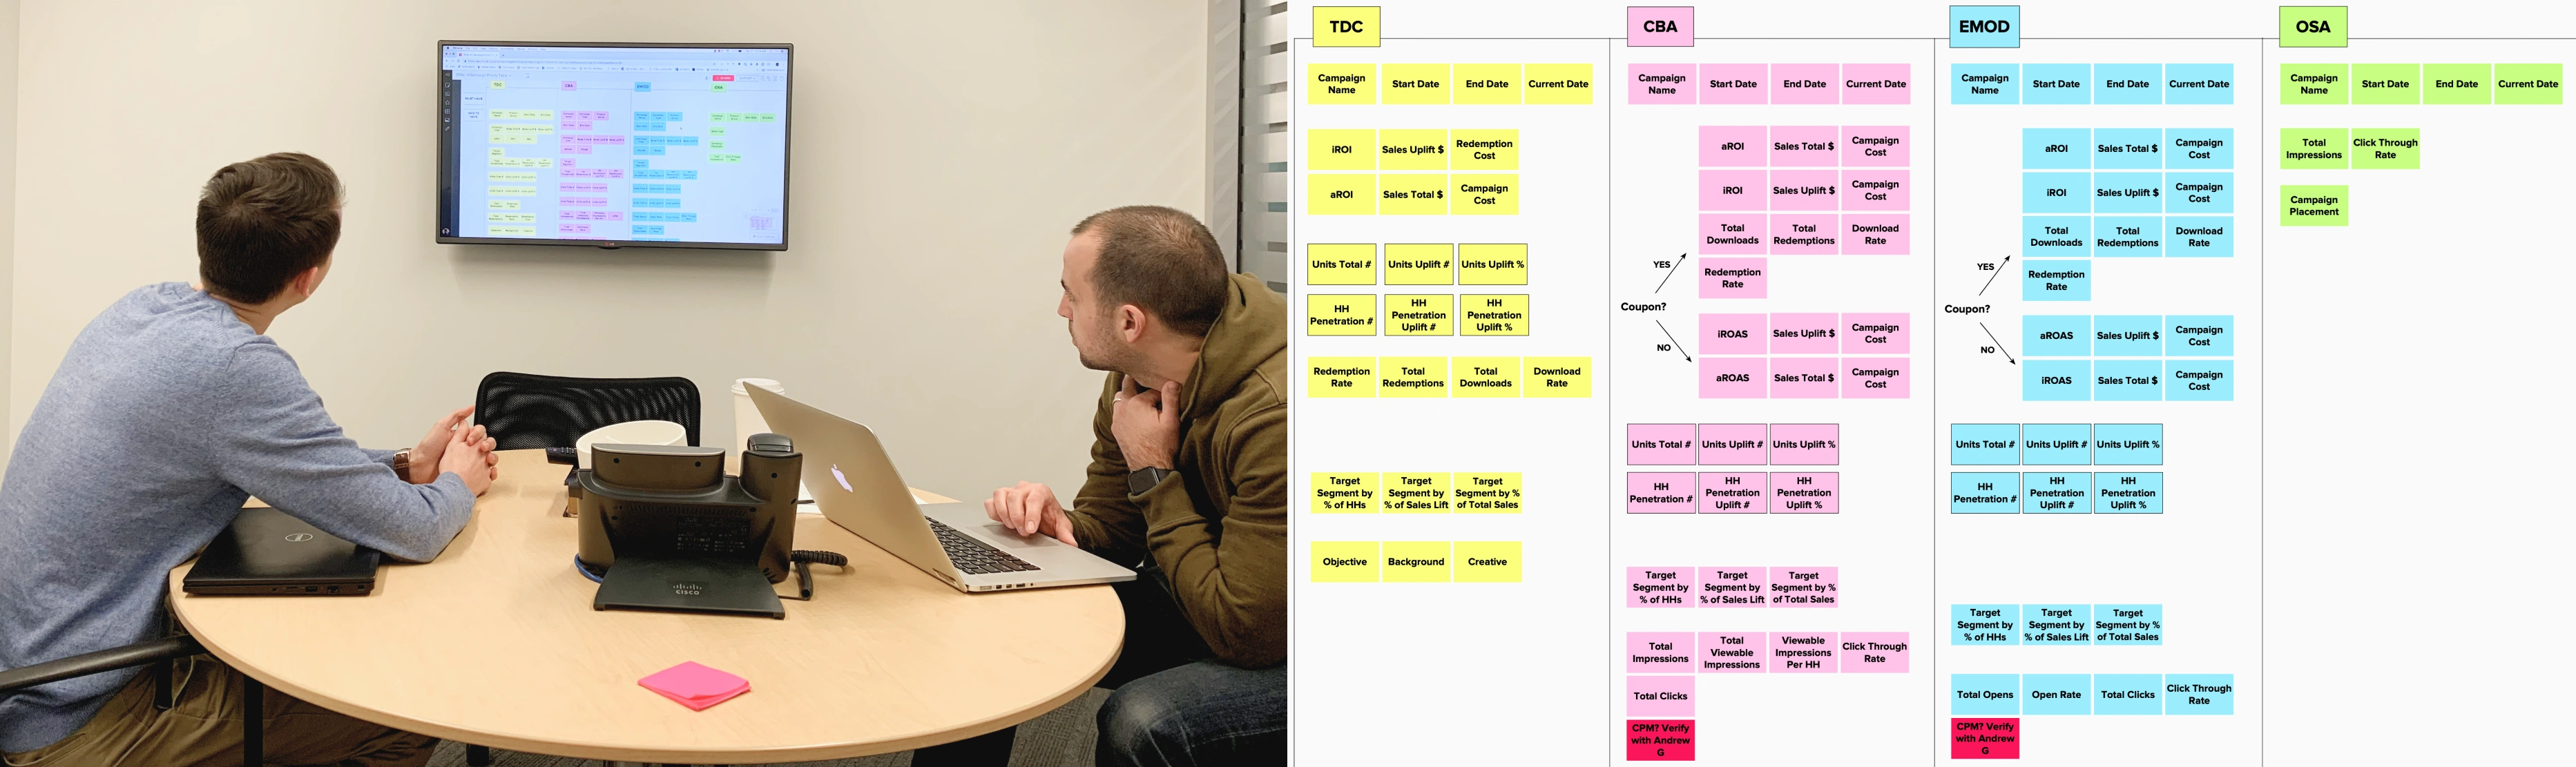
During one exercise, a marketing lead prioritized “media spend efficiency” as a top metric when optimizing regional campaigns. This feedback resulted in placing efficiency metrics higher in dashboard hierarchies for immediate visibility.

Metric prioritization session: Left shows stakeholder evaluating digital metrics board, while right displays structured information architecture for different campaign types with their respective metrics and hierarchies. - Interactive card exercises: Participants categorized subcategories and broader metrics in an engaging, visual manner, offering deeper insights into their mental models and decision-making processes.
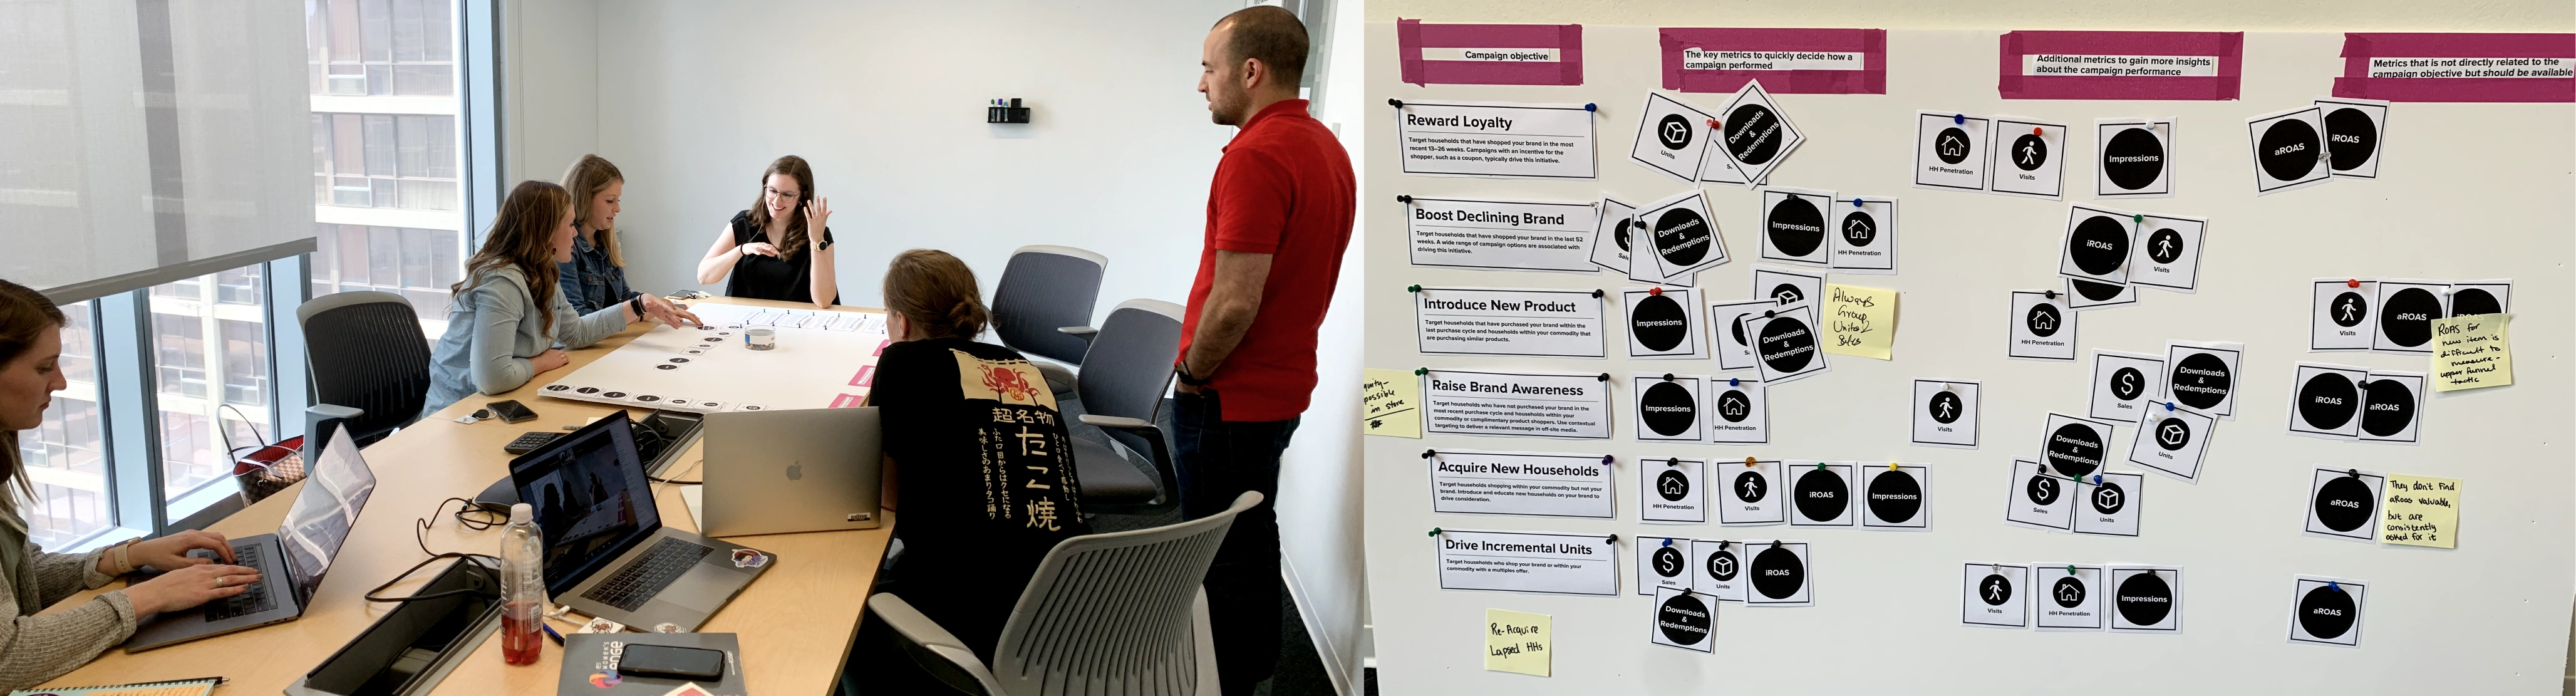
During one session, participants grouped metrics like “impressions” and “click-through rate” under “Engagement Metrics,” suggesting category reorganization in dashboards to better align with user priorities.
Card sorting workshop in progress: Left shows participants collaboratively organizing campaign metrics, while right displays the resulting category hierarchy mapping campaign objectives to their relevant performance indicators. - Scenario-based Q&A sessions: Quick, targeted questions validated specific challenges and tested assumptions about the system’s usability and data presentation.
A situational Q&A revealed that reviewers relied heavily on email notifications for real-time updates during campaigns. This insight led to designing in-app notification systems with clear triggers tied to critical metrics like pacing and error thresholds.
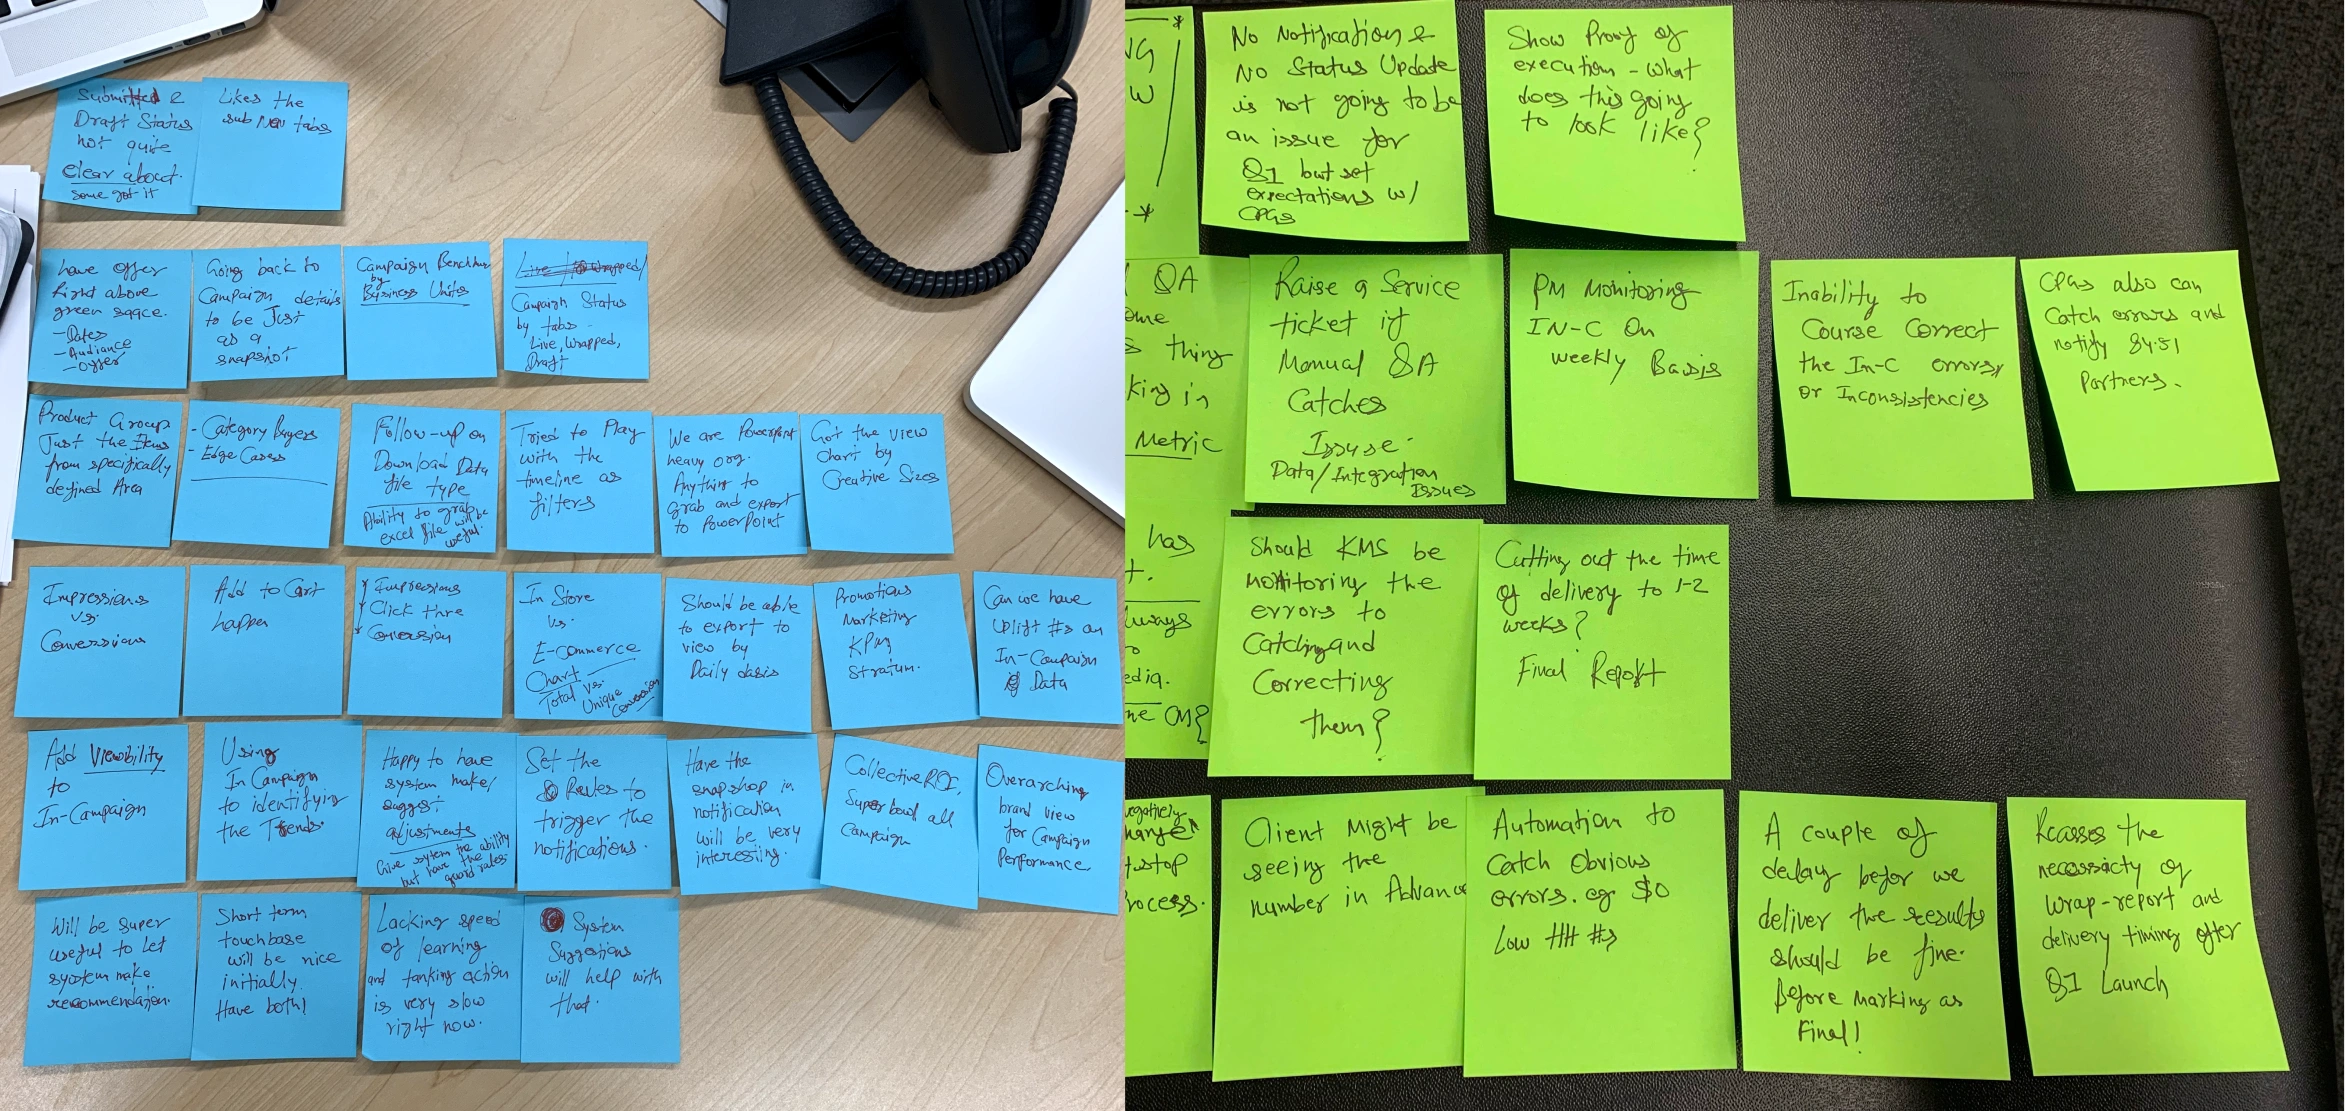
Design feedback captured notes during Q&A sessions, with blue notes documenting campaign monitoring requirements and green notes highlighting notification and delivery concerns.
Active and iterative testing: Through a highly collaborative process, testing involved frequent feedback cycles to continuously refine prototypes and adapt to user needs. Testing insights drove iterative adjustments to prototypes while influencing the prioritization of metrics and features.
Product roadmap
The roadmap was always intended to be a living document, evolving as the team gathered deeper insights and adapted to shifting priorities. Through continuous collaboration with stakeholders and product owners, the findings from user research and testing informed adjustments to focus on high-impact, low-effort features while maintaining a vision for long-term scalability.
- Low-hanging fruits: Research highlighted simple yet impactful enhancements, such as better integration of benchmark comparisons and clearer visibility for campaign pacing metrics. These features required minimal development effort but significantly improved usability and decision-making.
- Reassessing priorities: Some long-term features, initially prioritized for scalability, were shifted to later phases. This allowed the team to focus on immediate needs, such as enabling flexible filtering and customizable reporting options, which directly addressed frequent user challenges.
- Common edge cases: Testing uncovered previously overlooked edge scenarios that proved to be common pain points, such as users needing ad-hoc comparisons of campaign metrics across multiple regions. These were elevated in priority to deliver value quickly.
As insights began to crystallize, the roadmap was revisited to prioritize actionable, high-ROI features informed by direct user feedback:
| USE CASE (WHAT) | OUTCOMES (WHY) |
|---|---|
| Provide Users w/ KPIs Post Campaign | Users can decide whether to re-run a campaign or adjust a future campaign |
| Provide Users w/ Execution metrics during a campaign | Users can adjust a campaign on-the-fly |
| Provide Users w/ more granular data when desired | Users can get large amounts of data at any time & into other systems |
| Provide Users w/ recommendations from 84.51° | Clients don't have to make decisions on their own & are aware of options |
| Provide Users w/ Education and Support | Reduce time spent on "How do I ..." type questions |
| Provide Users w/ Roll-Up data | Users understand how their total investment is performing |
| Provide Users w/ Comparison data | Users understand how their investments compare to other like-investments |
| Provide Users w/ Measurement data throughout Prism | Users can make informed decisions throughout Prism without 'flipping' to Reporting |
Collaborative decision-making
Regular workshops and touchpoints with stakeholders ensured that the revised roadmap aligned with organizational goals and user needs. The iterative process:
- Provided a clear rationale for feature adjustments, ensuring stakeholder buy-in.
- Balanced short-term wins with the long-term vision, fostering confidence across teams.
- Strengthened alignment between business objectives and user priorities, creating a more actionable plan for execution.
Setting the stage
This updated roadmap served as a guiding artifact, maintaining its flexibility as the team transitioned into execution phases. It reflected a thoughtful balance between immediate impacts and the overarching vision, ensuring continued adaptability as new insights emerged.
Development and MVP execution
As the engagement transitioned into the development phase, the focus shifted toward embedding design practices into active sprint cycles while preparing the team for long-term scalability. By this stage, the team’s progression from prototypes to refined insights laid the groundwork for moving into high-fidelity designs and actionable development tasks.
Transitioning to high-fidelity design
With a clear roadmap and validated prototypes in place, the team transitioned to high-fidelity designs to:
- Finalize design decisions, ensuring alignment with technical requirements and user needs.
- Provide developers with precise assets and specifications, reducing ambiguity during implementation.
- Reflect the evolution from early-stage concepts to a production-ready state.
- Simplified navigation, clear data accessibility, and streamlined campaign management to enhance user productivity.

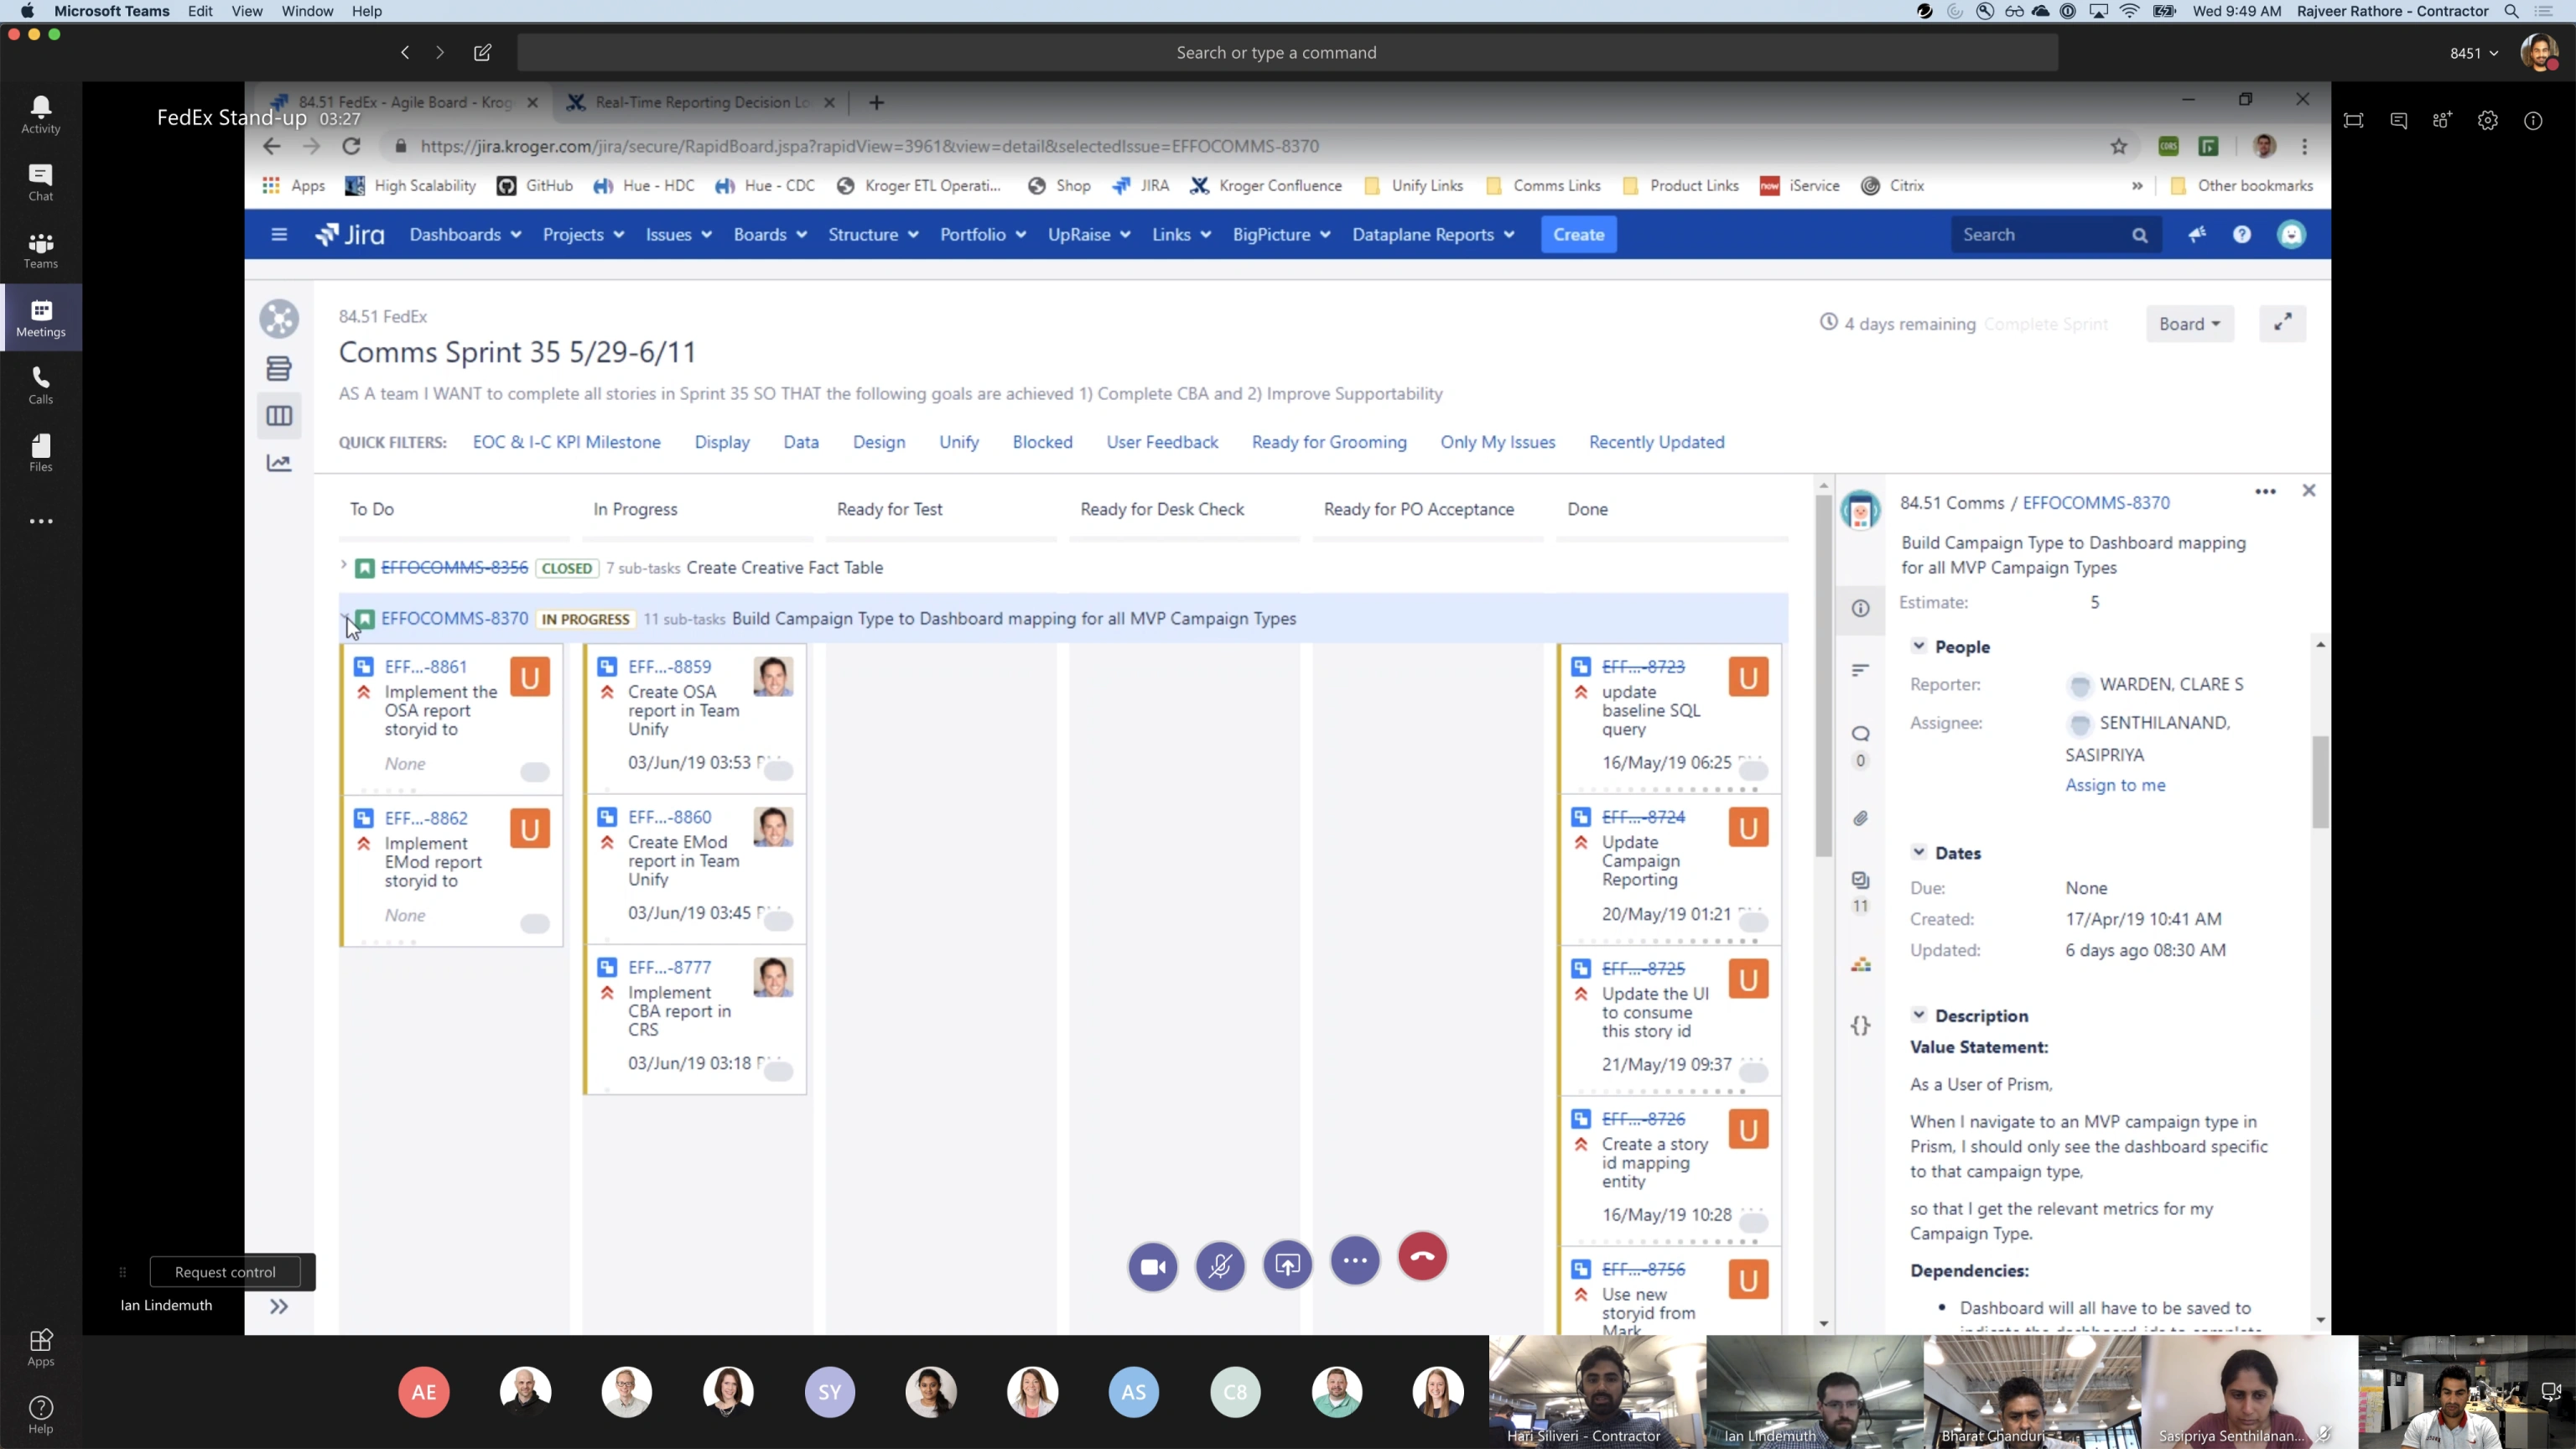
Embedding design into development
During the first 3 sprints, I worked alongside the scrum team to:
- Translate insights from user research and prototypes into tangible deliverables, such as feature prioritizations and technical requirements.
- Collaborate with developers to address feasibility challenges, ensuring alignment between design intent and technical capabilities.
- Adapt sprint outputs based on iterative feedback, reinforcing the team’s understanding of design as an ongoing process.
Preparing the team for continuity
As my engagement approached its conclusion, it became clear that the success of the initiative depended on enabling the in-house teams to sustain and scale the practices we had established. Beyond my immediate responsibilities within the Prism project, I took deliberate steps to foster collaboration, alignment, and long-term impact across the broader 84.51° ecosystem.
Expanding design thinking across teams
The 84.51° ecosystem included multiple teams working on projects outside Prism but within the same organizational framework. Recognizing this, I initiated efforts to bring these teams into the conversation:
- Engaging with broader teams: Regular discussions were held to showcase the design thinking practices developed within Prism, fostering awareness and alignment across the organization.
- Envisioning shared practices: These sessions encouraged teams to adopt similar iterative, user-focused approaches while adapting them to their unique challenges.
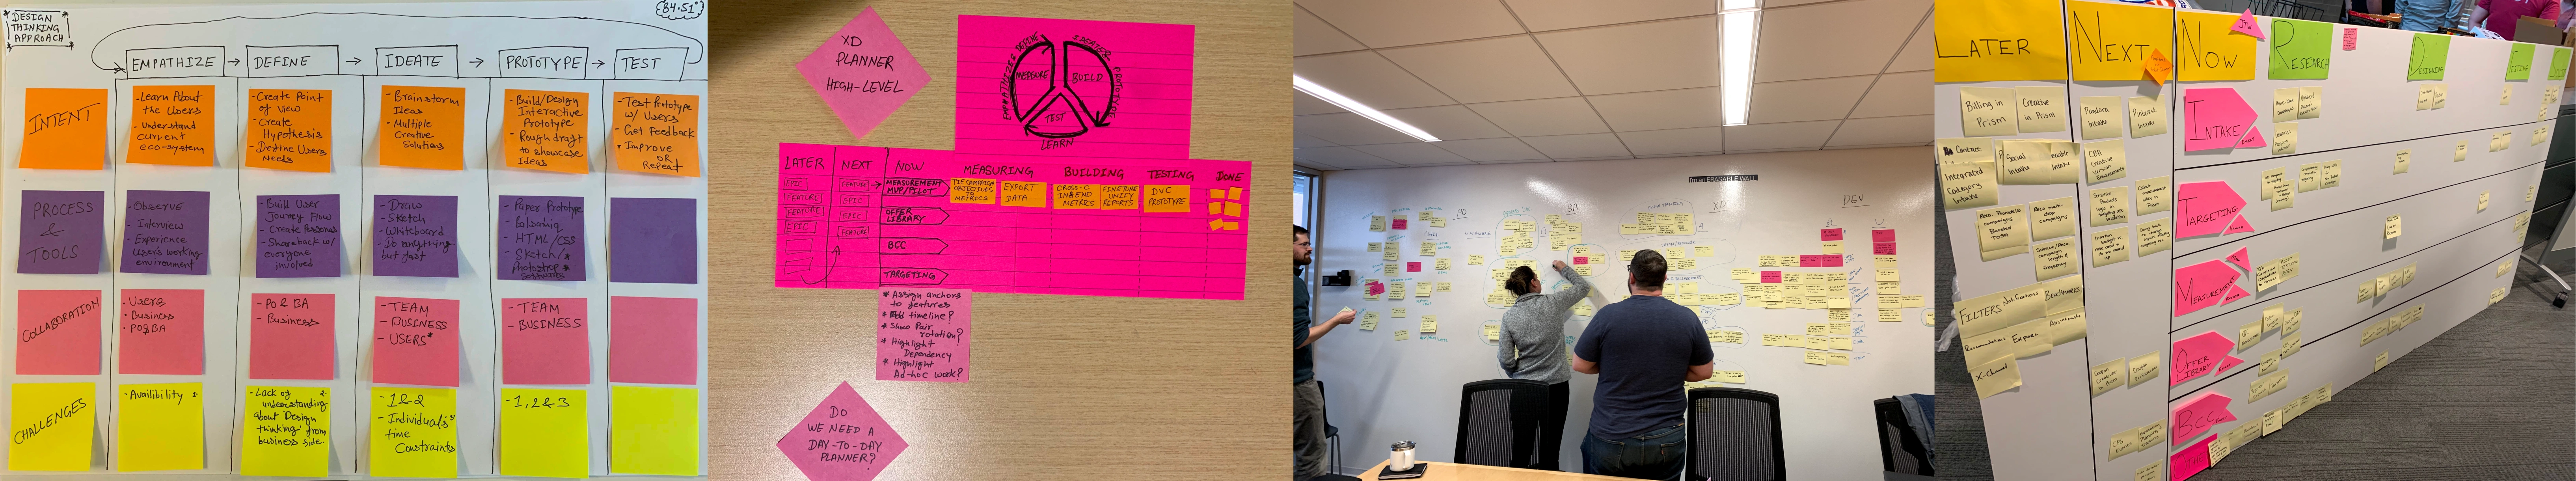
Introducing the design thinking workbook
One of the most impactful resources I introduced was the Design Thinking Workbook. This workbook served as a tangible case study, detailing the processes and outcomes achieved within the Prism initiative:
- Practical and actionable: The workbook captured real-world applications of design thinking, making it a relatable and valuable reference for teams.
- Building empathy and confidence: By showcasing how design thinking addressed complex challenges, the workbook fostered confidence and alignment across teams.
- Aligning cross-team practices: It became a central resource for embedding consistent design thinking principles across the organization.

Transitioning and outcomes
As my assignment with the Prism initiative reached its conclusion, the outcomes reflected the culmination of collaborative efforts across design, development, and product teams. Prism transitioned from a conceptual vision to a foundational element within the Kroger Precision Marketing (KPM) ecosystem.
To learn more about Prism's impact on retail media, visit the Kroger Precision Marketing (KPM) by 84.51°, or watch the promotional video below demonstrating how Prism revolutionized precision marketing through enhanced data integration and campaign optimization capabilities.
"This is game-changing for us. Instead of waiting weeks for campaign insights, we can now see how our media spend performs in real-time and make adjustments that actually move the needle. " Marketing Director, Fortune 500 CPG
Highlights of Prism’s success are outlined below, showcasing the measurable impact on targeting accuracy, efficiency, and overall return on investment.
- Enhanced targeting: 3,500+ data signals powered precise and personalized campaign strategies.
- Improved efficiency: Achieved 11x return on media investments by reducing waste and optimizing delivery.
- Industry recognition: KPM ranked #1 in targeting accuracy and measurement in 2023.
- Increased engagement: Campaigns saw a 10% uplift in household penetration, driving brand visibility.
- Real-time insights: 65% of campaigns utilized in-flight metrics to maximize ROI through adjustments.
- Faster decisions: Time-to-insight reduced by 40%, enabling quicker and better marketing decisions.
- Broader reach: Media strategies increased reach by 25% among target demographics.
Reflections
Working within the retail marketing space of Kroger Precision Marketing has been a humbling and enriching experience. This initiative reinforced the profound impact that small, thoughtful decisions in design and technology can have; shaping the way consumers engage with brands and driving meaningful outcomes for both businesses and the public.
This project also resonated deeply with my previous experience in the UK with the Co-op (Co-operative Group), where similarly intricate systems required careful alignment of design and technology to deliver impactful results. These parallels strengthened my appreciation for the complexity and scale of retail ecosystems and the importance of fostering collaboration across diverse teams.
As I transitioned out of this engagement, I carried with me a renewed understanding of how design and technology, when applied thoughtfully, can create value at scale. The privilege of contributing to such a vast and impactful initiative will remain a significant milestone in my professional journey.
"Rajveer led the development of a comprehensive customer analytics dashboard for 84.51's CPG advertising platform, transforming complex data into actionable insights. His contributions spanned the entire product development lifecycle - from initial research and user persona development to creating detailed interaction flows and building functional prototypes. Through his expertise in UX design and frontend development, Rajveer delivered an intuitive reporting system that precisely addressed our customers' measurement needs."
"Rajveer transformed how we worked by integrating design into our agile process, making collaboration with development seamless. His Design Thinking Workbook became a go-to resource, empowering the team to tackle challenges confidently. Beyond delivering great work, he set us up to continue these practices, leaving a lasting impact on our approach to design."